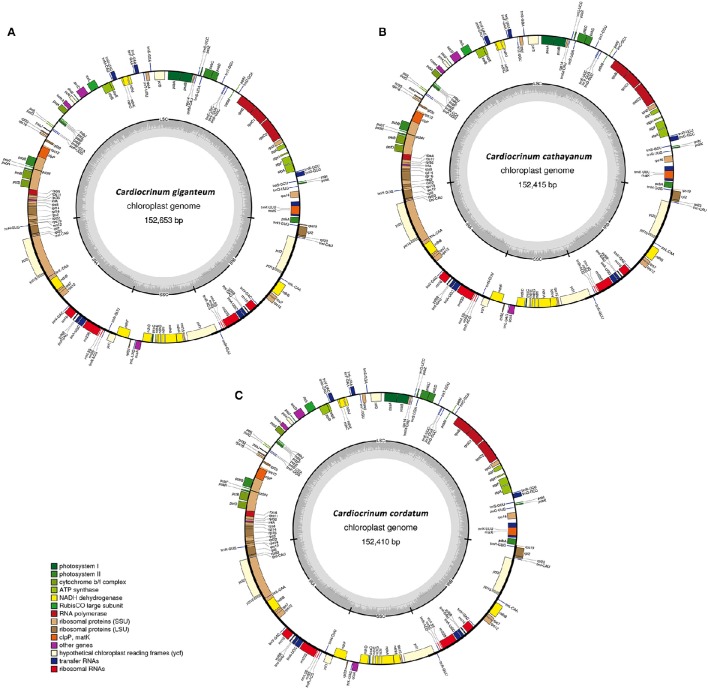
Figure 1.
Gene maps of the three Cardiocrinum chloroplast genomes. (A) Cardiocrinum giganteum; (B) C. cathayanum; (C) C. cordatum. Genes shown on the outside of the circle are transcribed clockwise, and genes inside are transcribed counter-clockwise. Genes belonging to different functional groups are color-coded. The darker gray in the inner corresponds to GC content, and the lighter gray corresponds to AT content.

