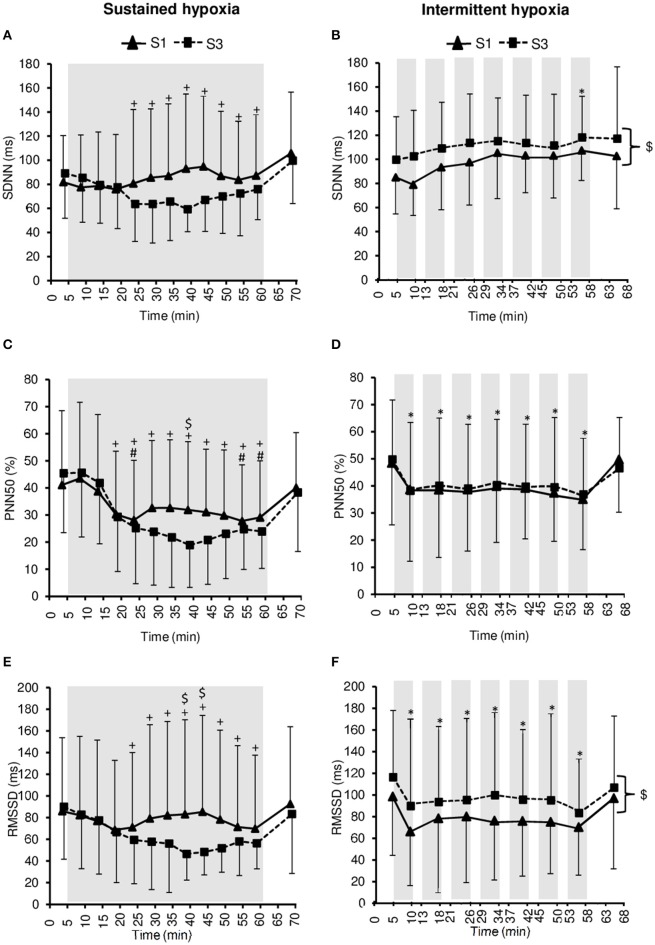
Figure 4.
Heart rate variability indices within the time domain [standard deviation of R–R interval (SDNN), (A,B); percentage of successive R–R that varied by 50 ms or more (PNN50), (C,D); root-mean-square difference of successive normal R–R intervals (RMSSD), (E,F)] during the first (S1) and the third (S3) sustained or intermittent hypoxia sessions. Data points are means ± SD. Gray areas indicate hypoxic phases. *Significantly different from normoxic baseline in both S1 and S3 (p < 0.05, two-way ANOVA main effect of time); +Significantly different from normoxic baseline in S3 only (p < 0.05, two-way ANOVA session × time interaction); #Significantly different from normoxic baseline in S1 only (p < 0.05, two-way ANOVA session × time interaction); $Significant difference between S1 and S3 (p < 0.05, two-way ANOVA main effect of session or session × time interaction).

