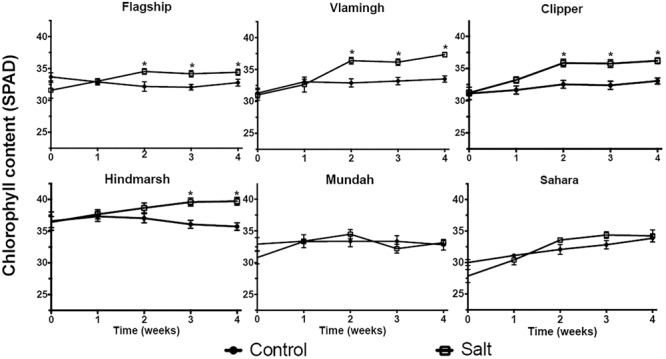
FIGURE 4.

Chlorophyll measurements of barley varieties under control and the salt-treated condition (150 mM NaCl). Data are presented as mean ± standard error, N = 10. Concentrations that are significantly (p < 0.05) different between control and the salt treatment for each time period are indicated with asterisks.
