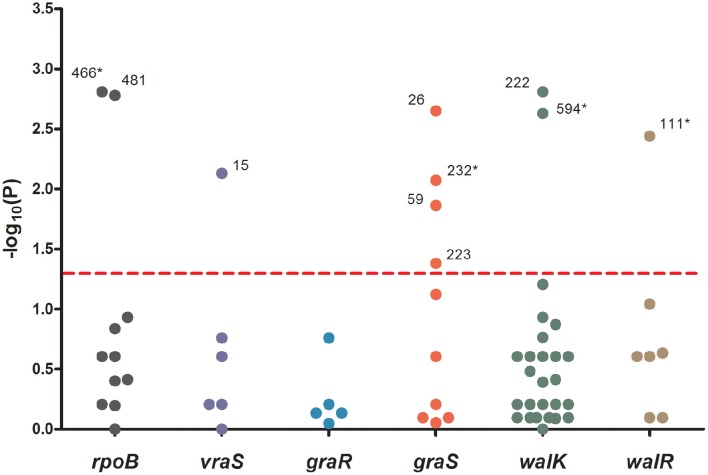
Figure 2.
The significance of association between each mutation sites and MICs. Data was analyzed by Jonckheere-Terpstra (JT) trend test. The x axis shown six sequenced genes and the y axis shown −log10 of the P values resulting from the JT trend test. Each dot represented a mutation site, and the number beside the dot shown the amino acid position. P < 0.05 were considered significant. *The novel mutation sites found in this study.

