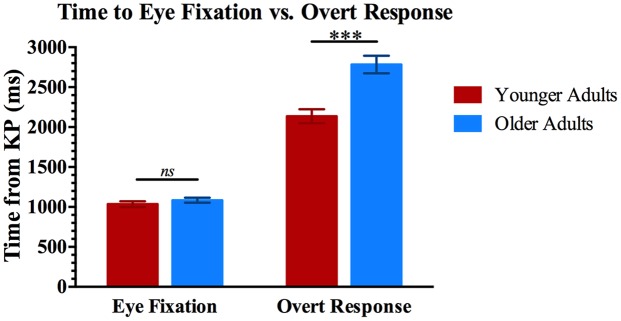
Figure 2.
Results for gaze time and overt responses. Two vertical bars on the left show mean latencies from the KP in a sentence to the time point when younger and older adults’ eyes fixated longer on the target picture than on the lures (EFT). Two vertical bars on the right show the mean latency from the KP in a sentence to the selection of the correct target picture with a computer mouse (ORT). Error bars are one standard error. ***Significant pairwise differences, p < 0.001.

