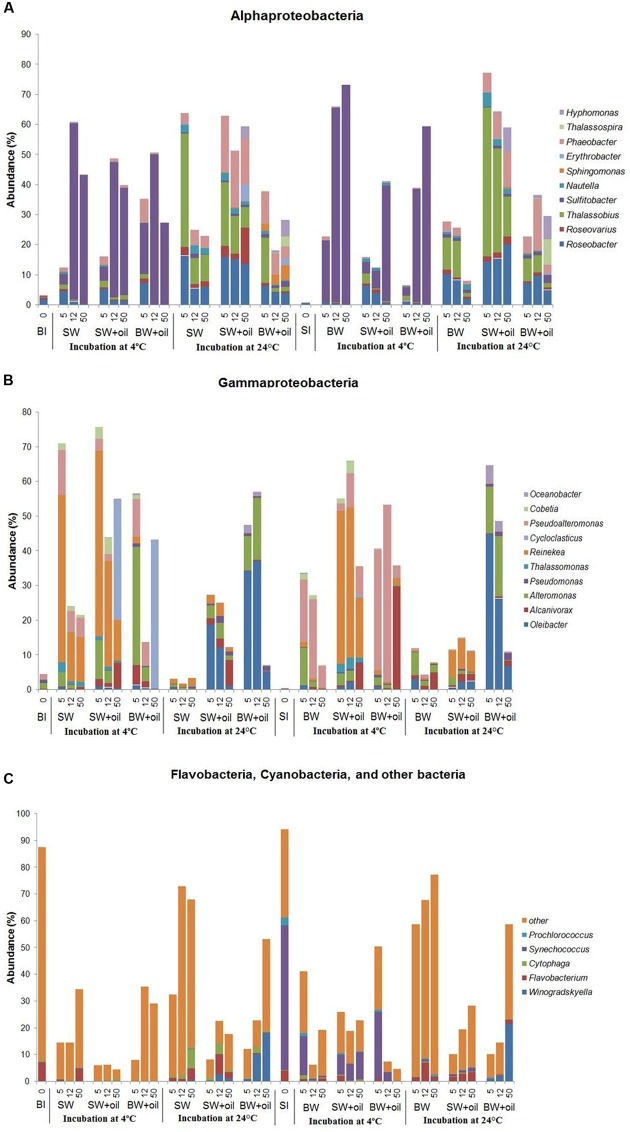
FIGURE 4.
Changes in the relative abundances of bacteria at genus level in incubation experiments with or without crude oil. Only abundances greater than 2% in at least one of the samples are shown except for other bacteria. (A) Alphaproteobacteria, (B) Gammaproteobacteria, (C) Flavobacteia, Cyanobacteria, and other bacteria. Filtered SW or filtered BW inoculated with bottom bacterial community (BI) or with surface bacterial community (SI). Treatments were incubated at 4 or 24°C. The numbers on horizontal axis indicate the days of incubation.

