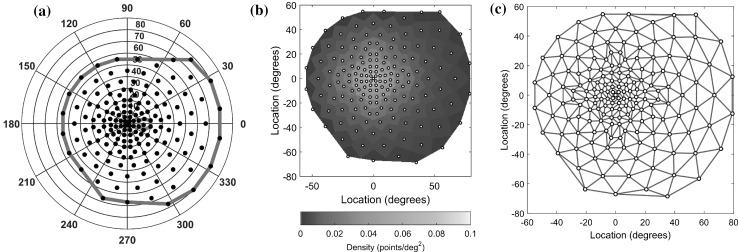
Fig. 1.
Details of the perimetry test grid pattern. a Sample points (black circles), convex hull (red line), and expected location of the optic disk and natural blind spot (green line) for the right eye. The grid spans 135° horizontally and 125° vertically. b Voronoi diagram of the sampling density showing the central condensation of the pattern. c Delaunay triangulation of the grid pattern

