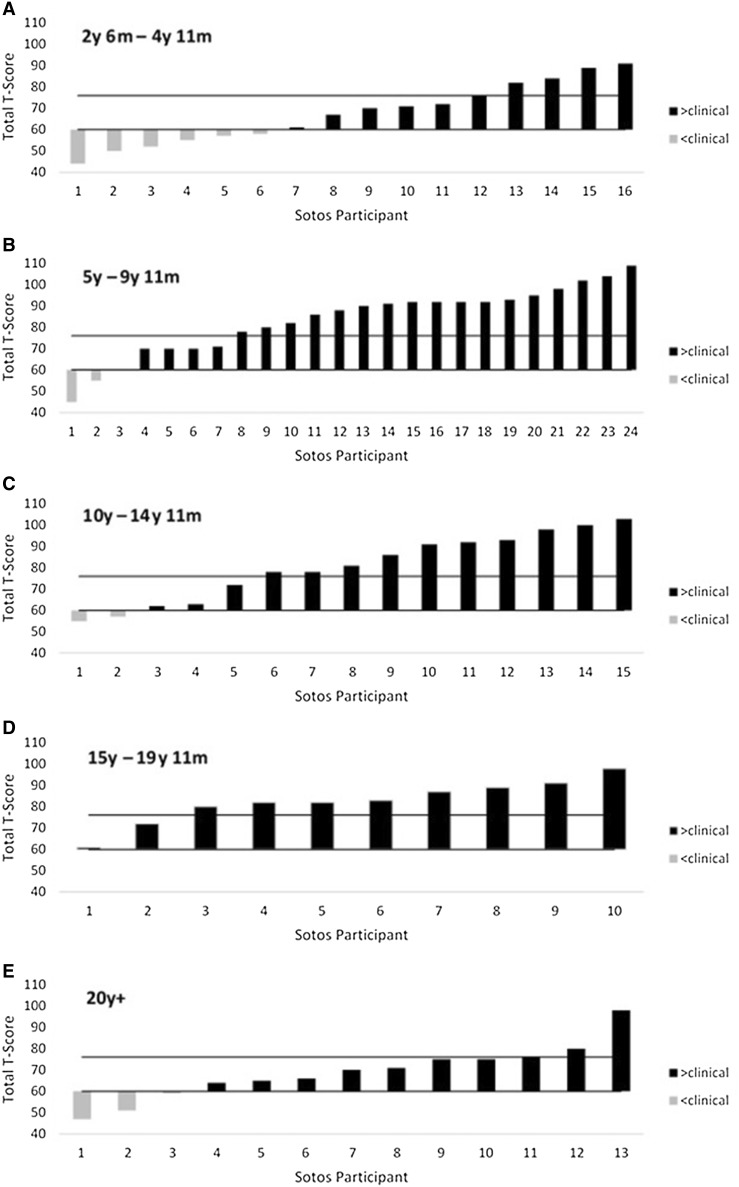
Fig. 2.
Waterfall plots of SRS-2 total T-scores by age category. In a–e, total T-scores are shown for Sotos individuals in distinct age categories: 2 years 6 months to 4 years 11 months, 5 years to 9 years 11 months, 10 years to 14 years 11 months, 15 years to 19 years 11 months and 20 years+, respectively. In each, the lower line depicts a T-score of 60. Scores below this line are non-clinical and scores on or above this line are in the mild and moderate symptom severity range. The upper line depicts a T-score of 76 and scores on or above this line are in the severe symptom severity range. In a, scores in the severe range were reported in 5 children (31.25 %). In b, scores in the severe range were reported in 17 children (70.83 %). In c, scores in the severe range were reported in 10 children (66.67 %). In d, scores in the severe range were reported in 8 individuals (80 %). In e, scores in the severe range were reported in 3 individuals (23.08 %)

