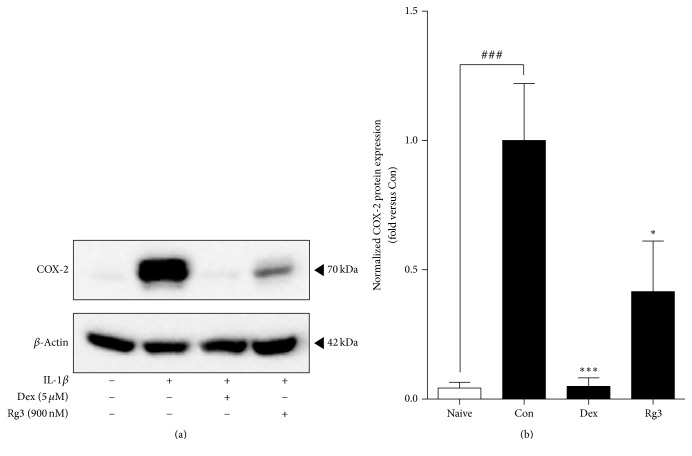
Figure 3.
Inhibited IL-1β-stimulated COX-2 expression by Rg3 in inflamed A549 cells. (a) The western blot results in representative three separate experiments. (b) COX-2 expression level normalized with β-actin was measured by densitometry analysis and represented as bar charts. Statistical significance was determined by unpaired t test (one-tail) compared to Con. Values are means ± SEM. ###P< 0.001; ∗P< 0.05; ∗∗∗P< 0.001. Naive: normal condition; Con: IL-1β treated A549 cells.

