
Figure 2.
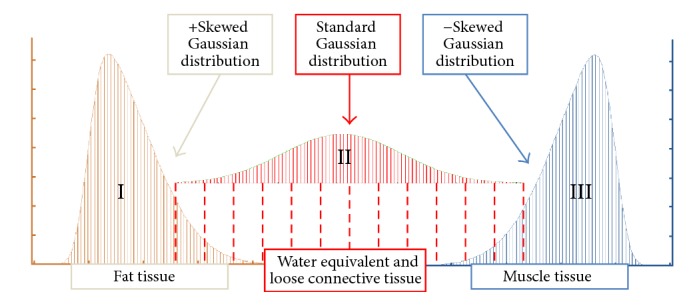
Diagram depicting the three components of the trimodal radiodensitometric distribution utilized in this study. This figure illustrates the location and skewness of each probability density function, with tissue types as previously defined.
Official websites use .gov
A
.gov website belongs to an official
government organization in the United States.
Secure .gov websites use HTTPS
A lock (
) or https:// means you've safely
connected to the .gov website. Share sensitive
information only on official, secure websites.
Diagram depicting the three components of the trimodal radiodensitometric distribution utilized in this study. This figure illustrates the location and skewness of each probability density function, with tissue types as previously defined.