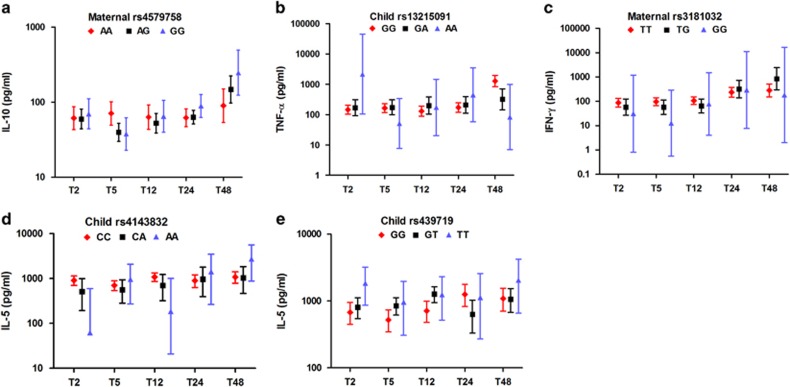
Figure 2.
Child's PHA-induced cytokines over time, based on maternal or child genotypes. Only SNPs that showed significant associations in the multivariate models are shown. Error bars represent geometric means of (a) IL-10, (b) TNF-α, (c) IFN-γ and (d and e) IL-5 levels of children at the age of 2 months (T2), 5 months (T5), 12 months (T12), 24 months (T24) and 48 months (T48). Red dots/interrupted lines indicate the children having or born to mothers with major homozygote alleles, whereas black dots/solid lines for heterozygotes and blue dots and solid lines for minor homozygotes. All values were adjusted for maternal cytokines, village of residence and child's gender.

