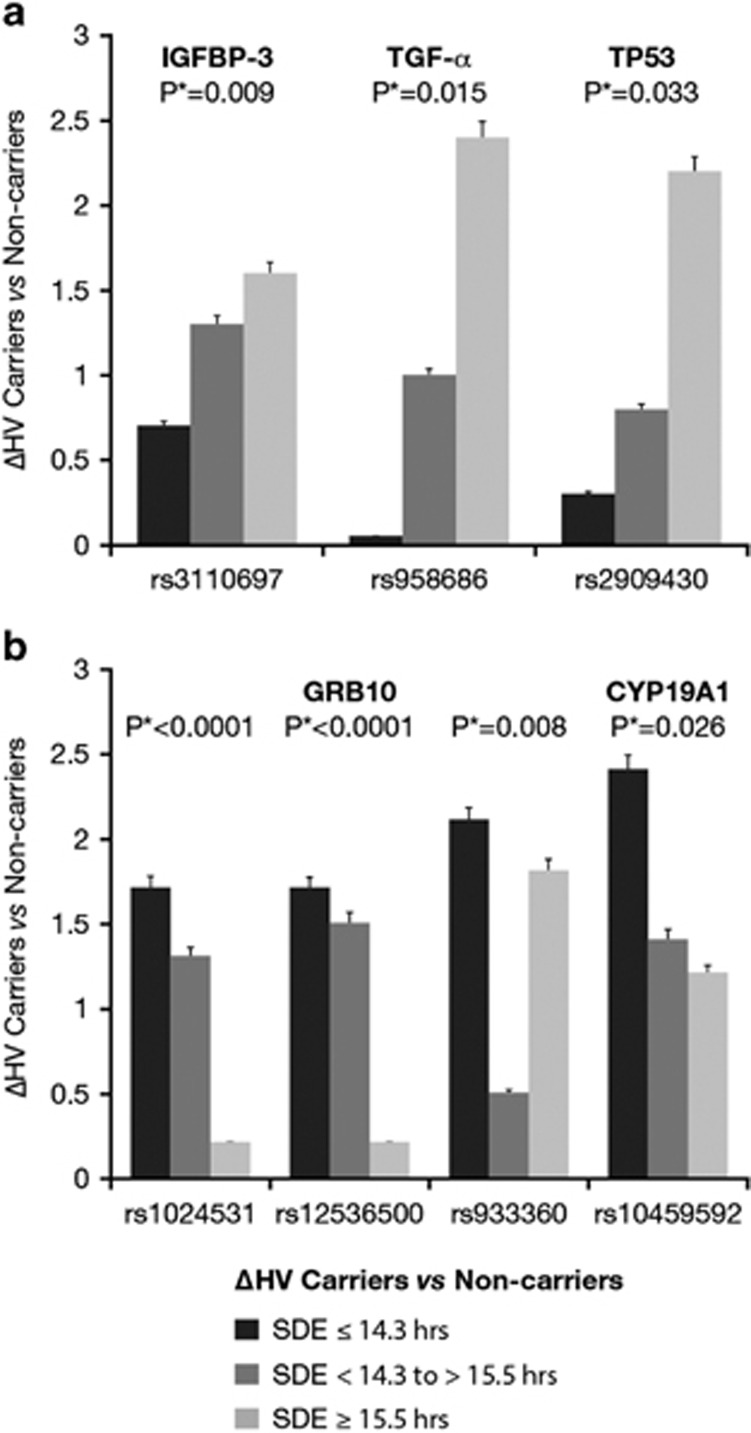
Figure 4.
Delta HV (ΔHV, cm per year) between carriers and non-carriers for each SNP by summer daylight group is shown. This relates to the results from the generalised linear model, evaluating a carriage (carriage vs non-carriage of the SNP) and group (high vs intermediate vs low summer daylight exposure (SDE)) effect on 1-year growth velocity (cm per year). P*=significant (<0.05). In (a) the ΔHV is greatest in the group with the highest number of SDE hours (for IGFBP-3, TGF-α and TP53). The difference in HV varies among SDE groups, ranging from 2.4 to 1.6 cm per year at higher to 0.0–0.7 cm per year at lower SDE. In (b) the ΔHV is greatest in the group with the lowest number of SDE hours (for GRB10 and CYP19A1). The difference in HV ranged from 2.4 to 1.7 cm per year at lower to 0.2 to 1.8 cm per year at higher SDE.

