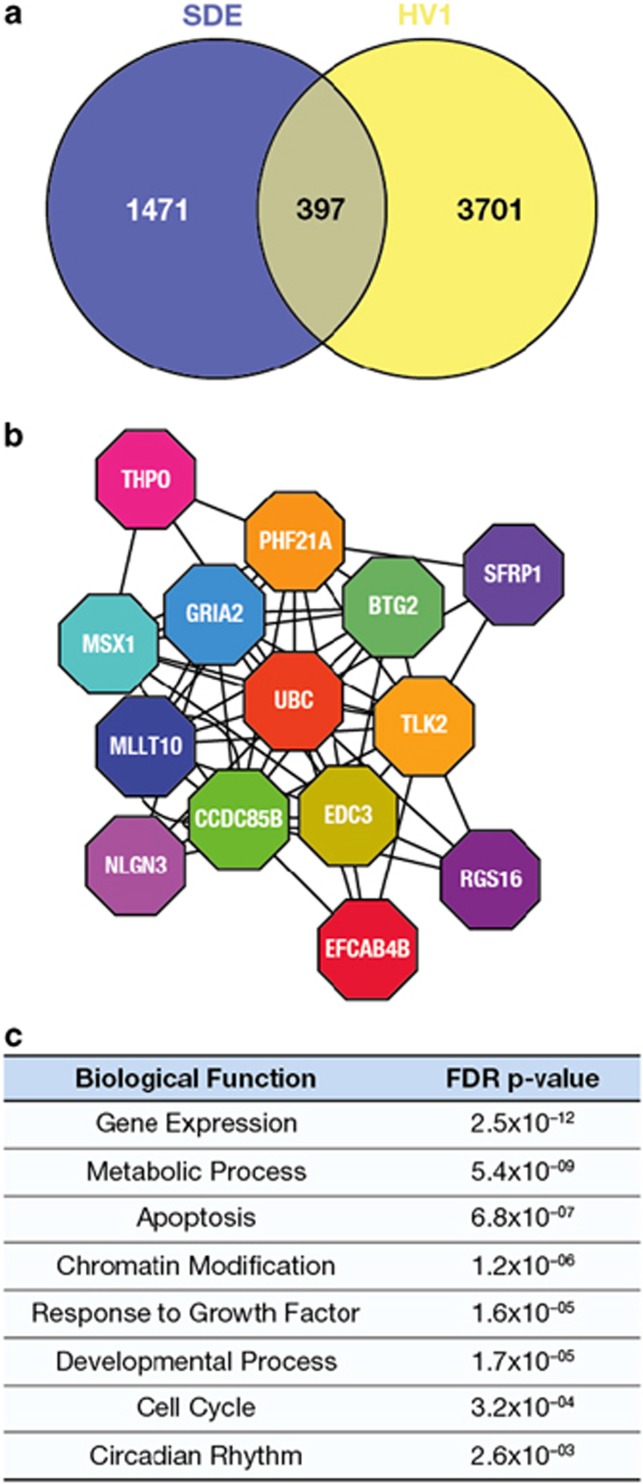
Figure 5.
Overlap of gene expression associated with both HV and SDE and subsequent network analysis of the common genes [n=60 GHD patients]. (a) Venn diagram of overlap (397, P=0.0015 hypergeometric test) between genes correlated with SDE (1868) and HV (4098) (no covariates, rank regression P<0.05). (b) Overlapping gene set correlated with SDE and HV using the same covariates as used for the partial least square regression (gender, GH peak, r-hGH dose, BW SDS, baseline age, BMI and distance to TH SDS) (Supplementary Table S1) was used to generate an interactome model. Clusters of related genes were identified within the interactome model using the Moduland algorithm and a network of the cluster modules was generated (shown) where the different coloured octagons represent clusters and the gene name is the most central gene element within that cluster (Supplementary Table S2). (c) Biological pathways associated with the overlap between the clusters were identified using the Geneontology.org database (hypergeometric test with a Benjamini–Hochberg false discovery rate (FDR) modified P-value).

