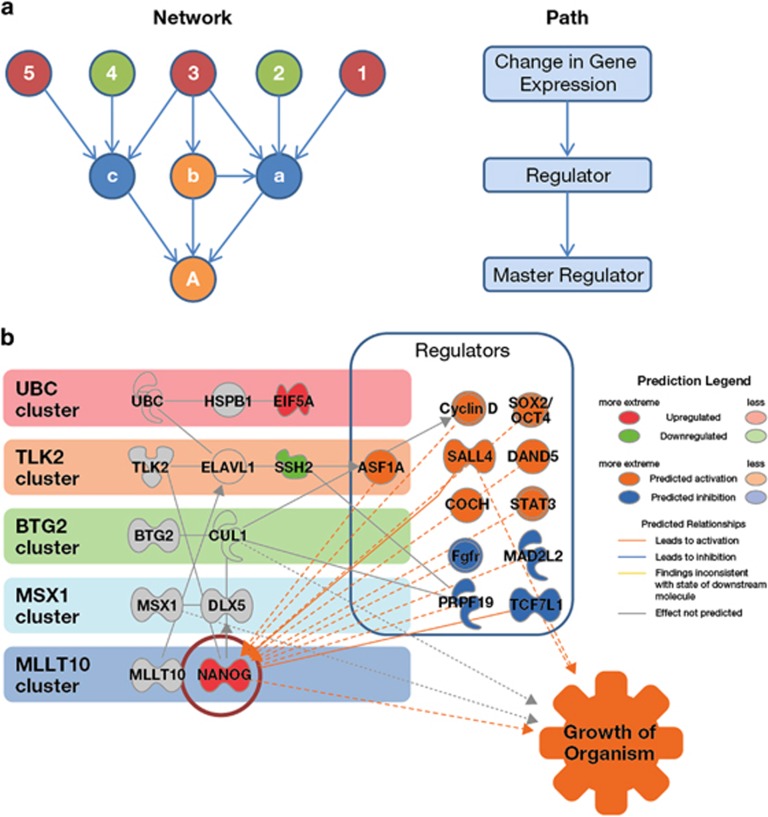
Figure 6.
Causal analysis and mechanistic modelling of the subset of genes common to both HV and SDE. (a) Causal network analysis takes the genes with altered expression (examples numbered 1–5, green (low expression) and red (high expression)) and identifies upstream molecules up to three steps distant. This approach provides insight into information flow within the network using the known literature to identify network edges linking to upstream regulators (a–c) and master regulators (A), for which there is statistical evidence (Fisher's exact test) to support a corresponding causal relationship (within Ingenuity Pathway Analysis software). The most significant causal edges between regulators are then used to construct networks downstream of a ‘master' regulator to indicate possible mechanisms. (b) Regulators of gene expression with matched action in both HV and SDE were identified by causal network analysis and hierarchical clustering of results (Supplementary Table S3). These data were mapped onto the clusters identified within the network model of the overlap of gene expression and implicated NANOG as a prime target of regulation. Grey=opposing correlated expression with HV and SDE, green=negatively correlated with both HV and SDE, red=positively correlated with both HV and SDE, uncoloured=inferred interaction, orange=predicted activated regulator, blue=predicted inhibited regulator.

