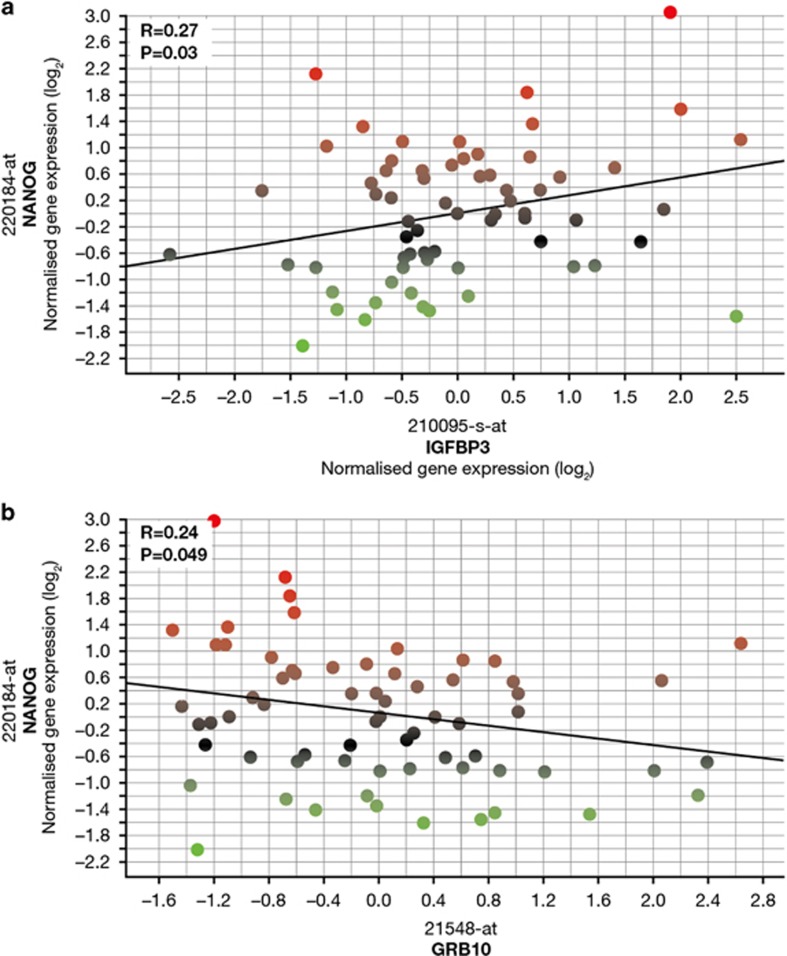
Figure 7.
Correlation of NANOG expression with gene expression from genes with single-nucleotide polymorphisms associated with both height velocity and summer daylight exposure. NANOG gene expression probeset 220184_at correlated against: (a) IGFBP-3, a gene where the rs3110697 SNP has a greater effect on height velocity at higher levels of SDE (Figure 5), using gene expression probeset 210095_s_at and (b) GRB10, a gene where the rs1024531, rs12536500 and rs933360 SNPs have a reduced effect on height velocity at higher levels of SDE (Figure 5), using gene expression probeset 215248_at. Analysis performed with the same covariates as used for the PLSR (gender, GH peak, r-hGH dose, BW SDS, baseline age, BMI and distance to TH SDS). Red (high) to green (low) gradation of colour represents level of expression of NANOG.

