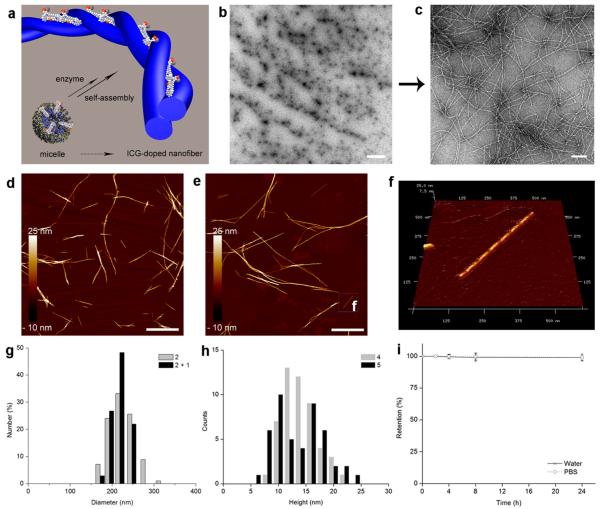
Figure 1.
Enzyme-triggered self-assembly of ICG-doped nanofiber 5 in solution. (a) Schematic conversion of micelles to nanofiber via an enzyme-catalyzed dephosphorylation. TEM images of the negatively stained (b) micelles (scale bar: 1 μm) and (c) 5 (scale bar: 100 nm). AFM images of (d) 4 and (e,f) 5 (scale bars: 1 μm). (g) Size distributions of 2 and 2 + 1 measured by dynamic light scattering. (h) Height histograms of 4 and 5 determined from AFM images. (i) Retention of 5 dialyzed in water or PBS at 37 °C. Data are presented as mean ± SD (n = 3).

