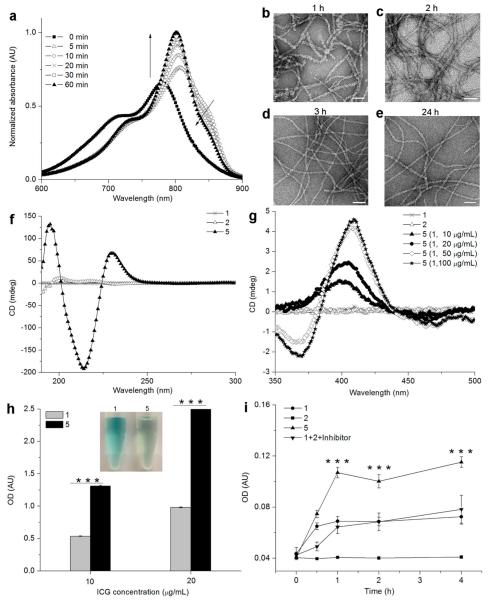
Figure 2.
Optical property and structure conformations of 5. (a) Time-course UV–vis spectra of 5 during ALP-catalyzed process. (b–e) TEM images of 5 at different aging time points. (f) CD spectra of 1, 2, and 5. (g) CD spectra of 5 with different concentrations of 1 (2, 100 μg/mL). (h) Optical density (OD) changes at 808 nm of 1 and 5 at different ICG concentrations (1 and 2 in a ratio of 1:100). The inset is the corresponding photograph of 1 at 10 μg/mL. ***P < 0.001. (i) OD changes at 808 nm of cellular phosphatase-triggered self-assembly on HeLa cells incubated with different samples (1, 10 μg/mL; 2, 500 μg/mL). ***P < 0.001.

