Figure 3.
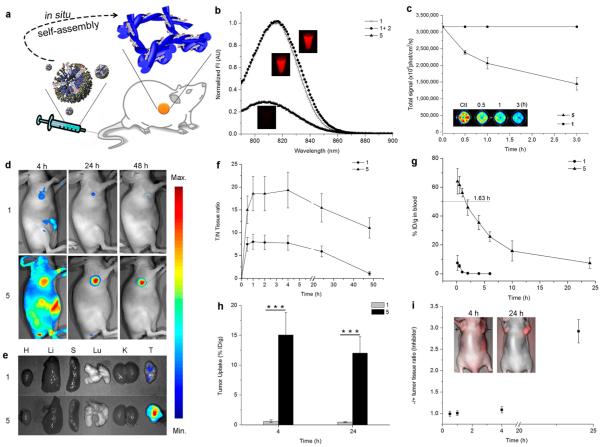
In vivo in situ enzyme-triggered self-assembly of 5 monitoring by fluorescence imaging. (a) Scheme of in situ conversion of micelles to nanofiber after intravenous injection. (b) Fluorescence spectra of 1, 1 + 2, and 5 (1 and 2 in a ratio of 1:100; the insets are corresponding fluorescence images). (c) Fluorescence intensity changes of HeLa cells incubated with 1 (1, 10 μg/mL) and 5 (1, 10 μg/mL; 2, 500 μg/mL; inset is corresponding fluorescence image). (d) Representative NIR fluorescence images of 5 (1, 10 mg/kg; 2, 100 mg/kg, n = 4) and 1 (1, 10 mg/kg, n = 4) on HeLa-tumor-bearing mice after intravenous administration. Images were acquired at 4, 24, and 48 h postinjection (p.i.). (e) Ex vivo NIR fluorescence images of tumor tissues and major organs collected at 24 h p.i. (n = 4). (f) T/N ratio after intravenous injection of 1 or 1 + 2 (5) as a function of time. Data are presented as mean ± SD (n = 4). (g) Blood circulation curves of 1 or 1 + 2 (5) in mice after intravenous injection determined based on ICG fluorescence in the blood lysates. Data are presented as mean ± SD (n = 4) (h) Tumor ICG uptake of 1 or 5 in HeLa-tumor-bearing nude mice 4 or 24 h after injection (%ID g−1 = percentage of the injected dose per gram of tissue). The ICG content was determined by the ICG fluorescence from diluted tissue lysates. Data are presented as mean ± SD (n = 4). ***P < 0.001. (i) NIR fluorescence intensity ratio of tumor tissues without or with phosphatase inhibitor. The insets are corresponding fluorescence images. Data are presented as mean ± SD (n = 4).

