
Fig. 5.
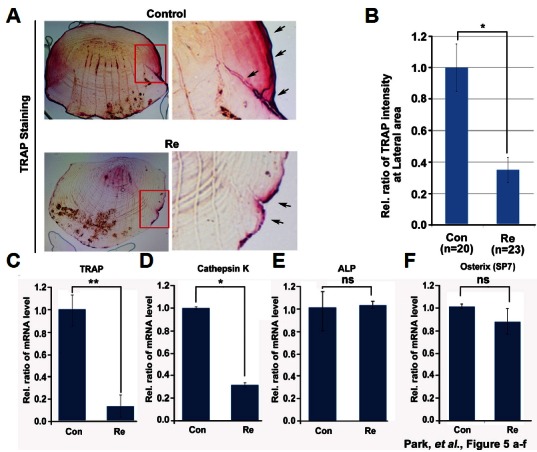
Effect of ginsenoside Re on zebrafish scale osteoclasts. (A) Ginsenoside Re-treated zebrafish scales were stained with TRAP. Red box, magnified X200; arrow, TRAP-positive signal. (B) TRAP signal intensity was measured in lateral regions. Five randomly selected points were measured per treated scale. (C, D) qPCR was performed to determine the mRNA levels of the osteoclast markers TRAP and cathepsin K and (E, F) the osteoblasts markers ALP and osterix.*P < 0.05 and **P < 0.01 by student’s t-test.