
Fig. 2.
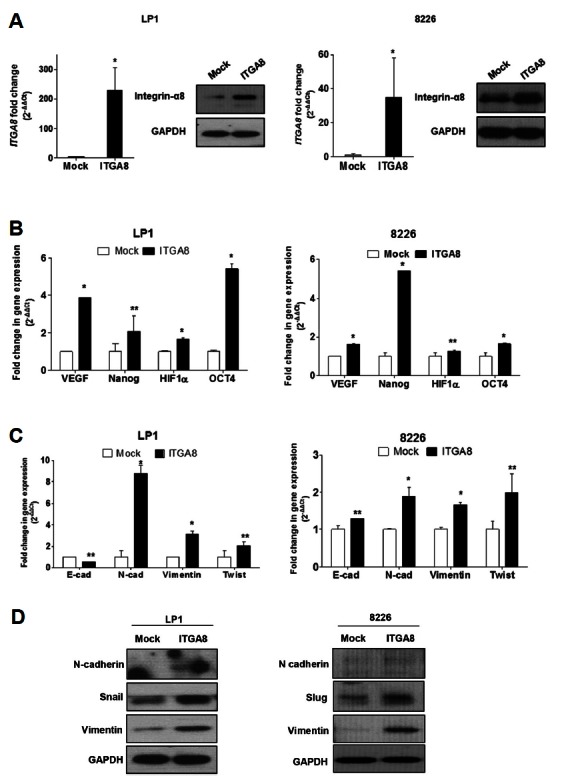
Gain of integrin-α8 expression regulates the markers of stem cell and EMT in MM cells. (A) Transfection of pCMV3-ITGA8-GFPSpark in LP1 and RPMI 8226 was confirmed based on the mRNA and protein level by qRT-PCR and western blotting, respectively (*P < 0.05). The 10 μg protein sample of LP1 and 15 μg protein sample of 8226 was loaded for western blot analyses. (B) Stemness phenotype including VEGF, NANOG, HIF1A, and OCT4 mRNA expression in integrin-α8 overexpressed LP1 and 8226 cells was confirmed by qRT-PCR and the data shown are the mean relative fold changes ± SD of three independent experiments compared to the control (*P < 0.05, **P > 0.2). Gene expression values in the samples were divided by those in the controls (i.e. each gene in the control is ‘1’). (C) The mRNA expression of EMT markers including E-cadherin, N-cadherin, vimentin and twist were measured in integrin-α8 overexpressed LP1 and 8226 cells. The data shown are the mean relative fold changes ± SD of three independent experiments (*P < 0.05, **P > 0.15). Gene expression values in the samples were divided by those in the controls (i.e. each gene in the control is ‘1’). (D) The protein level of EMT markers including N-cadherin, vimentin, slug, and snail was confirmed by Western blot analysis, and GAPDH was used as a loading control.