
Fig. 5.
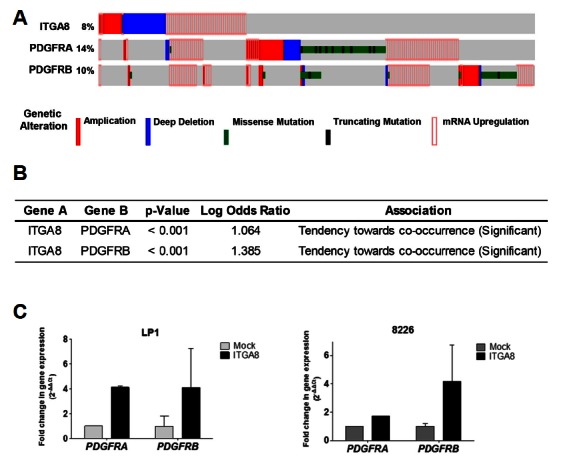
Crosstalk between ITGA8 and PDGFR signaling. (A) Data for genetic and expression alterations of ITGA8 were obtained from the cBioPortal cancer genomics platform (http://www.cbioportal.org). The 877 samples of all tumors having mRNA, CNA and sequencing data were analyzed. The % on the left represents the percentage of cases with alteration. (B) The tendency of co-occurrence between ITGA8 and PDGFRA or ITGA8 and PDGFRB. (C) The relative levels of PDGFRA and PDGFRB mRNA expression were confirmed using qRT-PCR in integrin-α8 overexpressed LP1 and 8226 cells and normalized to 18s transcript. The data shown are the mean relative fold changes ± SD of three independent experiments compared to the control. Gene expression values in the samples were divided by those in the controls (i.e. each gene in the control is ‘1’).