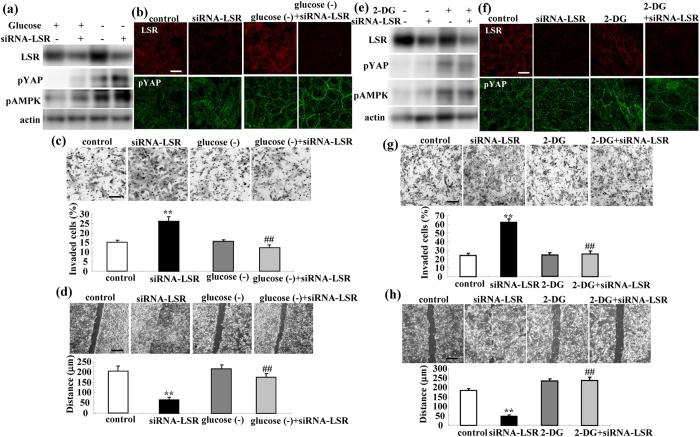
Figure 5. Glucose starvation and treatment with 2-DG induce expression of pYAP and pAMPK and prevent cell invasion and migration induced by loss of LSR.
(a) Western blotting for LSR, pYAP and pAMPK in LSR-knockdown Sawano cells with and without glucose starvation. (b) Immunocytochemical staining for LSR, pYAP and pAMPK in LSR-knockdown Sawano cells with and without glucose starvation. Scale bars: 20 μm. (c) Matrigel invasion assay of LSR-knockdown Sawano cells with and without glucose starvation. Scale bars: 100 μm. The results are shown as a bar graph. Control vs. siRNA-LSR: **p < 0.01. siRNA-LSR vs. siRNA-LSR + glucose starvation: ##p < 0.01. (d) Migration assay of LSR-knockdown Sawano cells with and without glucose starvation. Scale bars: 400 μm. The results are shown as a bar graph. Control vs. siRNA-LSR: **p < 0.01. siRNA-LSR vs. siRNA-LSR + glucose starvation: ##p < 0.01. (e) Western blotting for LSR, pYAP and pAMPK in LSR-knockdown Sawano cells with and without 2-DG. (f) Immunocytochemical staining for LSR, pYAP and pAMPK in LSR-knockdown Sawano cells with and without 2-DG. Scale bars: 20 μm. (g) Matrigel invasion assay of LSR-knockdown Sawano cells with or without glucose starvation. Scale bars: 100 μm. The results are shown as a bar graph. Control vs. siRNA-LSR: **p < 0.01. siRNA-LSR vs. siRNA-LSR + 2-DG: ##p < 0.01. (h) Migration assay of LSR-knockdown Sawano cells with and without 2-DG. Scale bars: 400 μm. The results are shown as a bar graph. Control vs. siRNA-LSR: **p < 0.01. siRNA-LSR vs. siRNA-LSR + 2-DG: ##p < 0.01.

