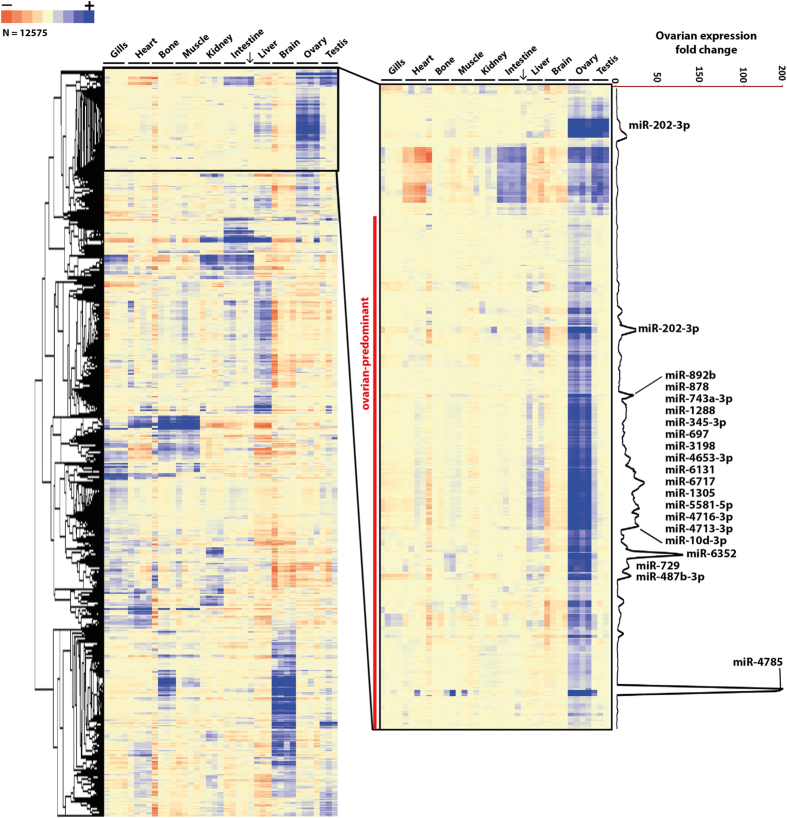
Figure 2. MicroRNA expression profiling in different medaka tissues.
Unsupervised clustering analysis of the differentially expressed microRNAs. Each row represents a single probe (16 probes per miRNA) and each column represents a tissue sample (gills, heart, bone, muscle, kidney, intestine, liver, brain, ovary and testis). Data were median-centered prior to the clustering analysis. For each miRNA probe, the expression level within the sample set is indicated using a color density scale. Blue and red are used for overexpression and underexpression, respectively. White is used for median expression. The arrow indicates a testis sample that clusters with the intestine samples, which is probably due to tissue contamination during sampling.

