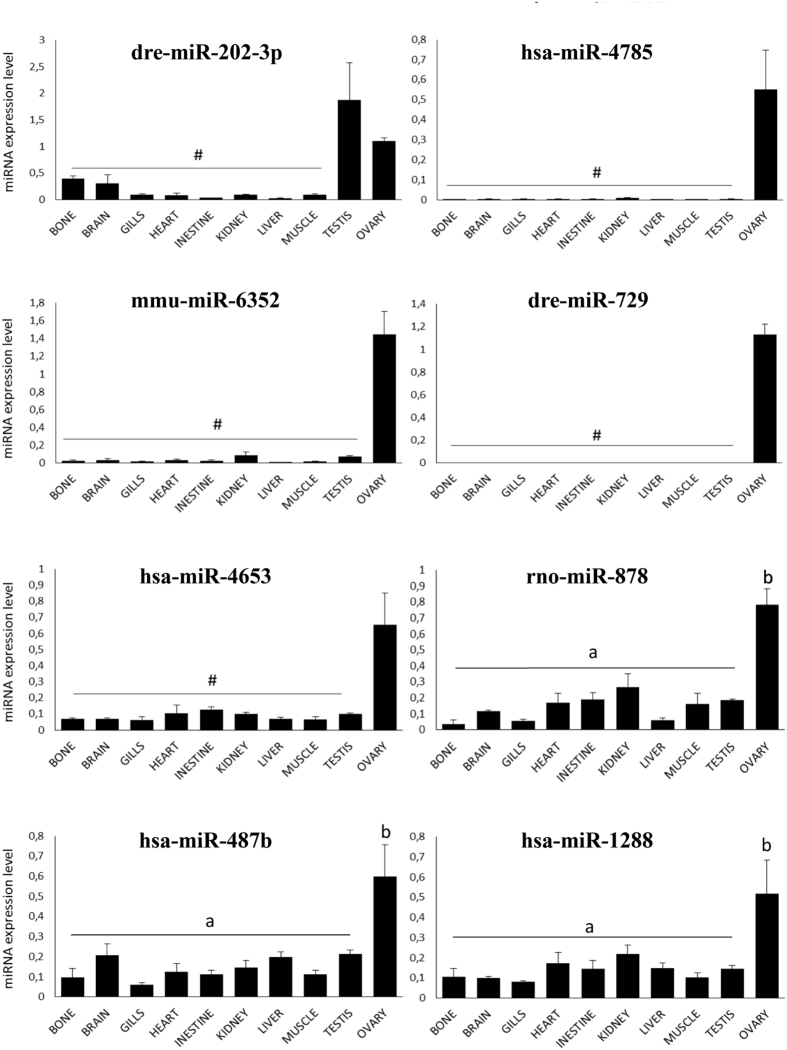
Figure 4. miRNA expression profiles obtained by QPCR using heterologous primers.
Four samples from different individual medaka fish were used for each tissue. Expression levels were measured in duplicates and the mean values (±SD) are displayed on the graphs. Data were normalized to the abundance of 18 S. a and b indicate expression levels that are significantly different (Wilcoxon test, p < 0.05). ab, expression levels not significantly different from a and b expression levels not significantly different from the background signal.

