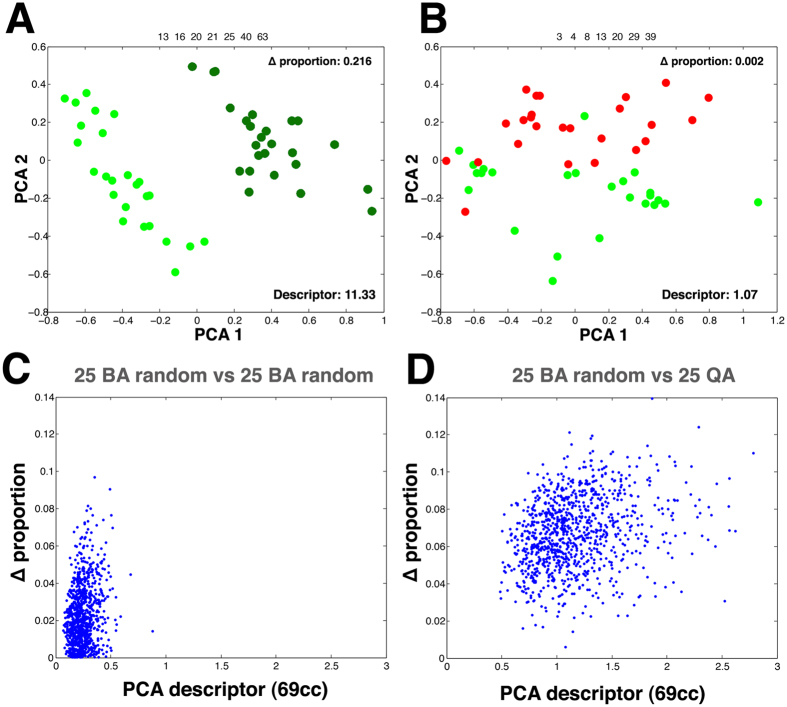
Figure 3. Influence of the proportion of slow fibres in the muscle organization.
(A) Comparison of 25 images from BA (light green dots) vs 25 images from BA (dark green dots) using two groups of BA images with a very different percentage of slow fibres (Δ proportion = 0.216) and a set of 69 characteristics. The result is a clear separation of both groups with a PCA descriptor of 11.33. (B) Comparison of 25 images from BA (green dots) with very similar percentage of slow fibres (Δ proportion = 0.002) than the 25 QA images (red dots) and a set of 69 characteristics. The graph shows some overlap between the two groups (PCA descriptors = 1.07). (C) Graph representing the 1,000 random comparison of 25 images random from BA versus 25 images random from BA (blue dots). “Δ proportion” of slow fibres is represented against the PCA descriptor value of the same random comparison. (D) Graph representing the 1,000 random comparison of 25 images random from BA versus QA (blue dots). “Δ proportion” of slow fibres is represented against the PCA descriptor value of the same random combination.

