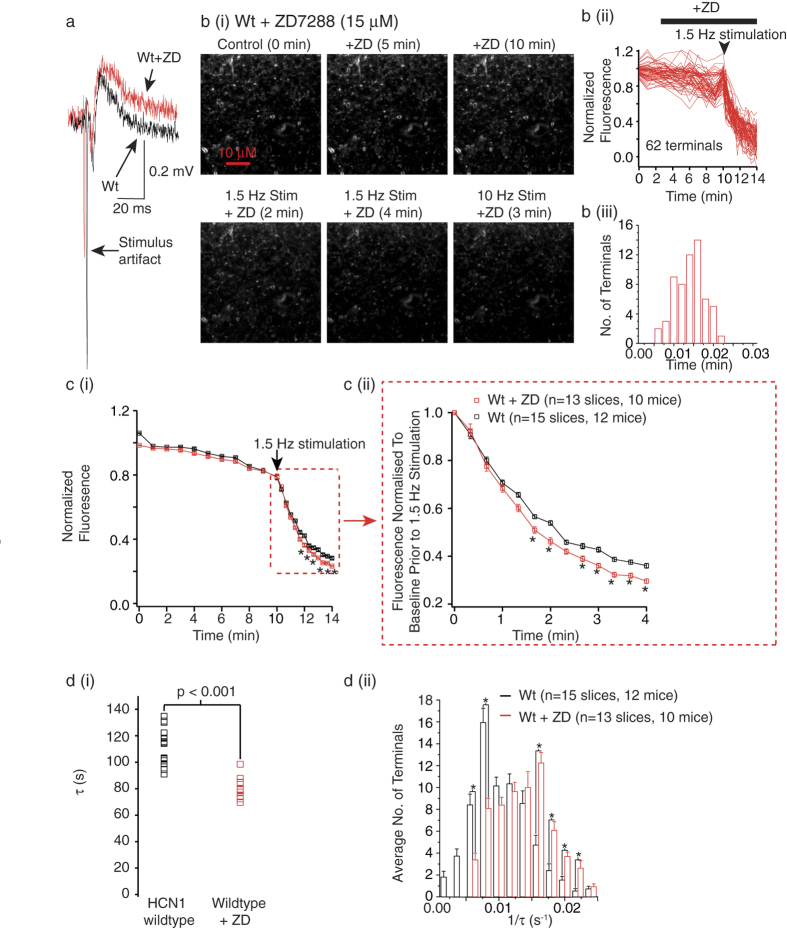
Figure 4. Pharmacological inhibition of HCN1 channels increases synaptic vesicle exocytosis.
(a) Field EPSPs under control conditions and following 20 min treatment of ZD7288 recorded in EC layer III. (b(i)) Images of FM1-43 loaded terminals in a wildtype (Wt) slice before and during treatment with ZD7288 in the absence and following 1.5 Hz and 10 Hz extracellular stimulation. The scale shown applies to all images within the panel. Quantification of the FM1-43 fluorescence and dye release rates from all individual terminals from this slice are shown in (b(ii) and b(iii)) respectively. (c(i)) Graph illustrating the changes in FM1-43 fluorescence in all wildtype slices in the absence and presence of ZD7288. The graph shows the changes in active FM1-43 fluorescence if normalized to the average of the first three points. (c(ii)) represents the same data when normalized to the FM1-43 fluorescence values just prior to the 1.5 Hz stimulation. (d(i)) Median decay time constant values from 15 wildtype slices and 13 wildtype slices treated with ZD7288. The average de-staining rates of the terminals during 1.5 Hz stimulation in slices treated with ZD7288 and untreated slices. Asterisks indicate significance at p < 0.05 (Supp. Tables 3 and 4).

