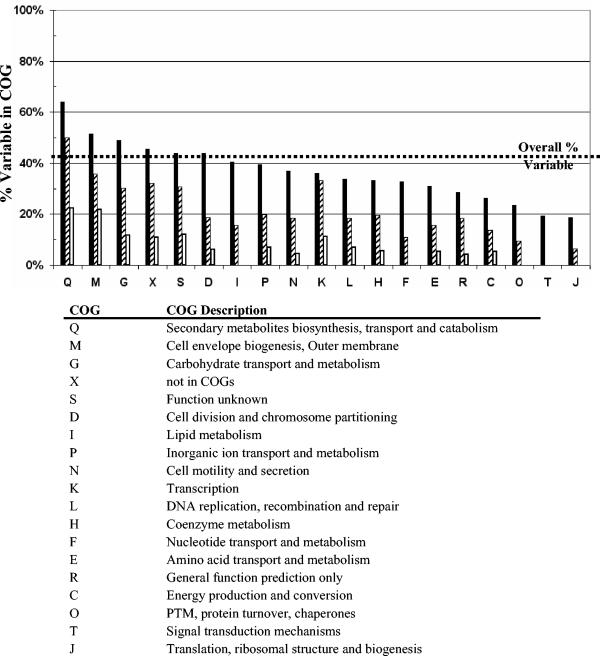
FIG. 3.
Gene conservation levels across different COG groups. Conservation levels were calculated as the percentage of variable genes in each COG group on the basis of the cumulative data from data sets I, II, III, and IV (black bars). The percentage of variable genes belonging to the HV group (striped bars) and the HD group (white bars) was also calculated for each COG. The HV and HD genes are defined in the text. COG X was created by the authors to denote all genes that do not fall under all other defined COG groups. HD and HV genes are not mutually exclusive, as their sum can exceed the total number of variable genes. PTM, posttranslational modification.

