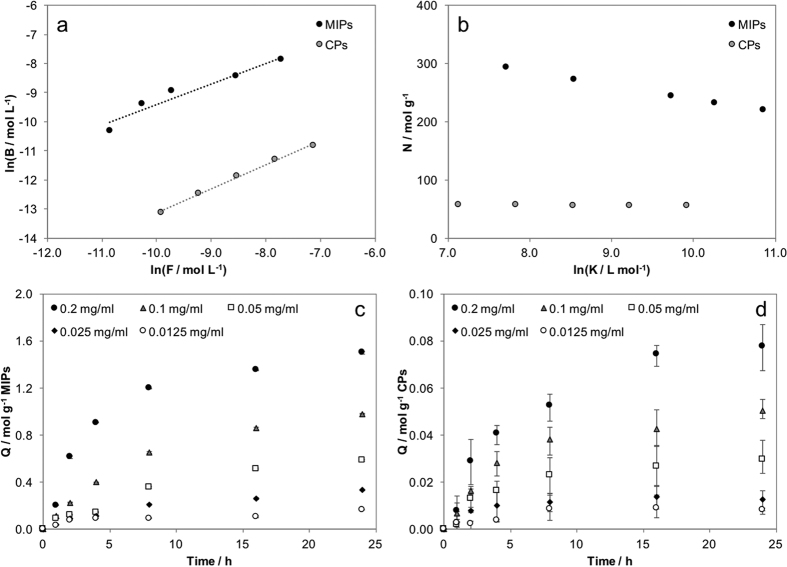
Figure 4.
Evaluation of affinity distribution (a) bound (B) vs free (F) concentration in isothermal sorption tests at different starting biotin concentration (b) distribution of binding sites as a function of the association constant K; Sorption kinetics of biotin at 37 °C for (c) MIPs and (d) CPs nanoparticles.

