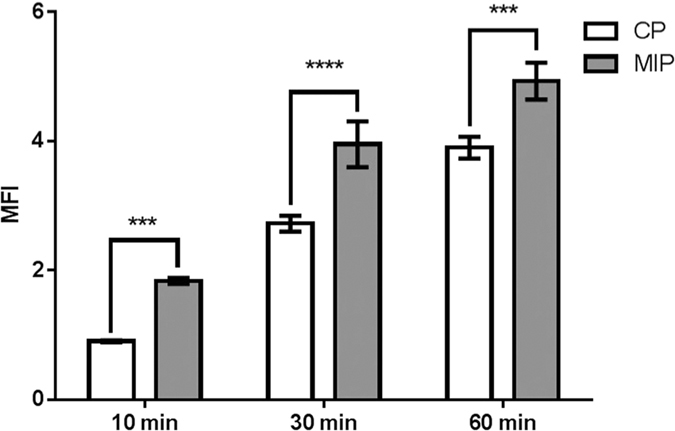
Figure 6. Nanoparticle internalisation into Hela cells.

Bar graphs represent the mean fluorescence intensity (MFI) of HeLa cells treated with control nanoparticles and MIP-nanoparticles; data are expressed as mean ± SE of at least three independent experiments; statistical significance versus controls was calculated using one-way ANOVA with Dunnett’s post hoc test (***p < 0.001, (****p < 0.0001).
