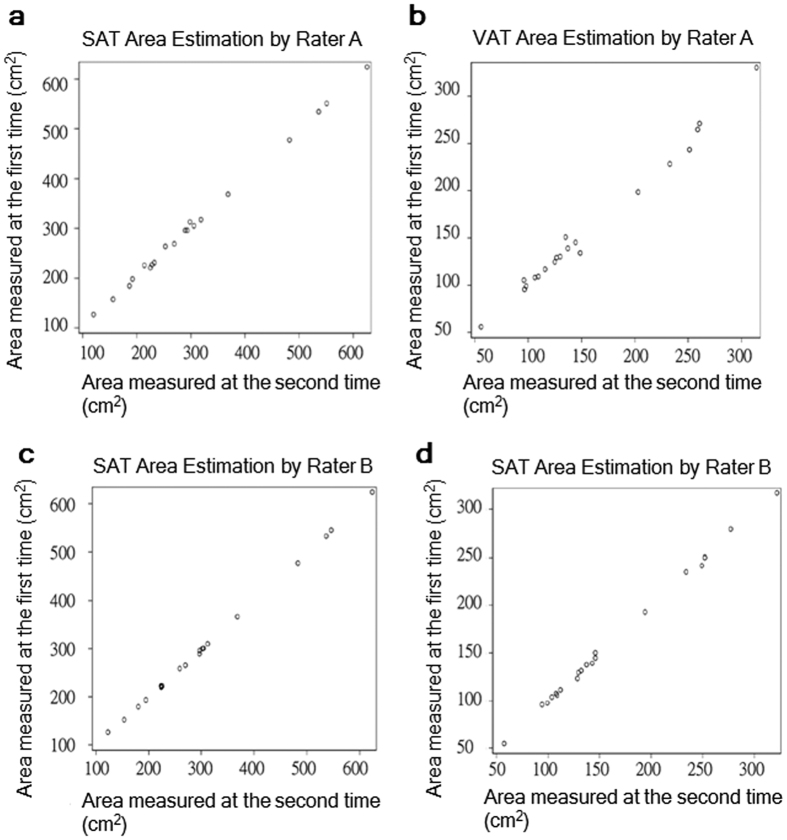
Figure 2. Intra-rater correlation of SAT area and VAT area estimates.
The strength of correlation between the 1st and 2nd estimates of SAT or VAT area was validated by Pearson’s correlation coefficient (r) and p value. (a) The intra-rater correlations for SAT (r = 0.99930, p < 0.0001) and (b) VAT (r = 0.99509, p < 0.0001) area estimates by Rater A. (c) The intra-rater correlations for SAT (r = 0.99988, p < 0.0001) and (b) VAT (r = 0.99928, p < 0.0001) area estimates by Rater B.

