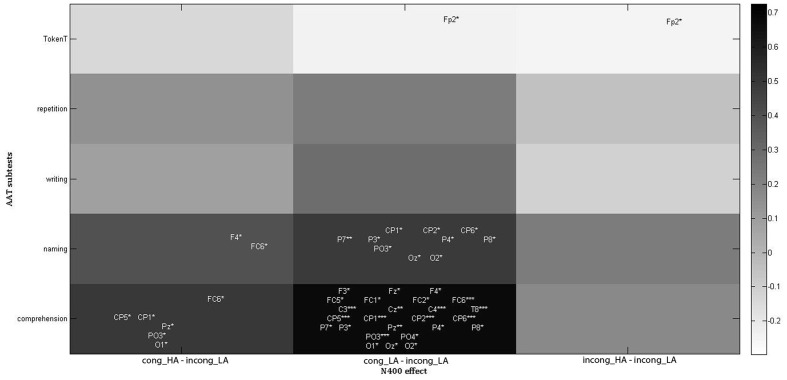
FIGURE 3.
Correlations between patient performance on AAT subtests and N400 effect size for each sentence group. The color bar represents correlation strength. The locations of electrode names show the approximate locations of the electrodes. Asterisks indicate the level of significance: ∗p < 0.05, ∗∗p < 0.01, ∗∗∗p < 0.005. For Rho values of significant correlations on each electrode position see Supplementary Table S2.

