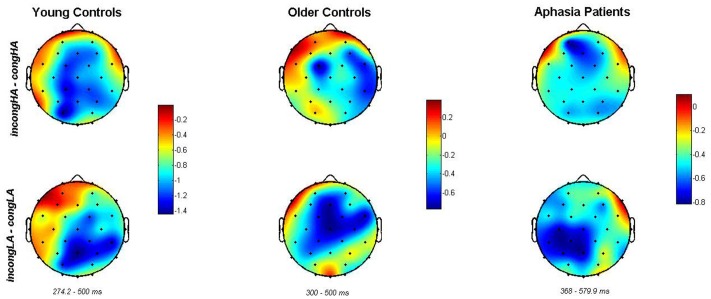
FIGURE 4.
Spatial distribution of N400 difference between congruent and incongruent sentences (top row: incong_HA – cong_HA, bottom row: incong_LA – cong_LA) across different subject groups (column-wise) given the time-range for each group. Color bars to the right of each pair of scalp plots in the same column refer to the amplitude difference between the mentioned sentence groups of the same subject group. The change in spatial distribution of negative activity (N400) across subject groups is presented.

