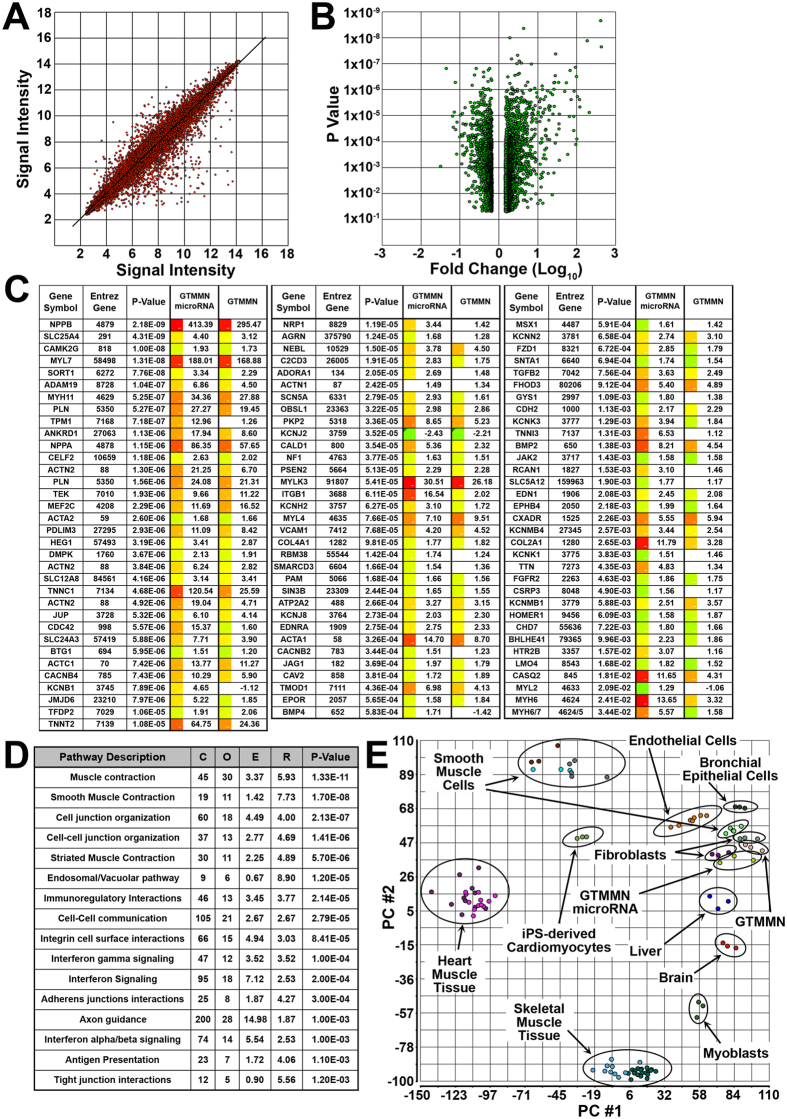
Figure 4. Microarray gene expression analysis.
(A) Signal intensity plot for individual chip probes when comparing iCM (cardiac TF and microRNA) to control HDF. (B) Volcano plot displaying the relationship between P-Value determined using ANOVA versus calculated fold change for each probe. Comparison between iCM (cardiac TF and microRNA) and control HDF. Including only probes with defined fold change (< or >1.5) and significant P-Value (<0.05). (C) Fold change and P-Value of selected genes previously described as playing a role in cardiac cell development or function. Fold change is shown for cells transdifferentiated in the presence of cardiac TF and microRNA or cardiac TF only (Red: 413.39, Green: −2.43). (D) Molecular pathways associated with significantly upregulated genes when comparing iCM to control HDF as determined by the WEB-based GEne SeT AnaLysis Toolkit (WebGestalt). The “Gene #” column refers to the number of identified genes that belong to a particular pathway and the “P-value” column refers to the P-value of each of the pathways and based on the number of identified genes. (C) reference gene number in category, O: number of genes in gene set and category, E: expected number in category, R: enrichment ratio. (E) Principal component analysis performed on normalized signal values for each of the chip probes as well as probes from previously published studies.

