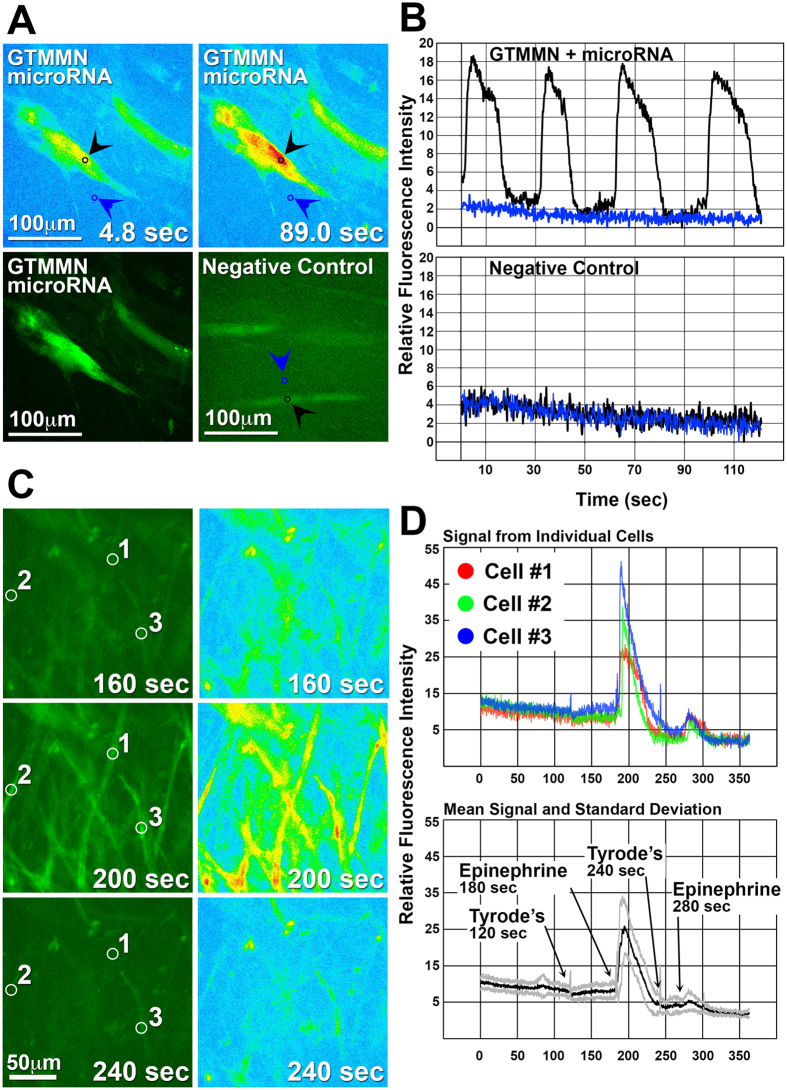
Figure 5. Characterization of intracellular Ca2+ activity.
iCML cells and control HDF were transduced with a vector allowing the expression of GCaMP3 under the control of the TNNT2 promoter. (A,B) Fluorescence intensity imaging of temporal Ca2+ transients in an iCML or control cell (M2rtTA only). Black arrows denote the area of a cell at which data acquisition was performed (fluorescence intensity) and blue arrows denote a control area within the same frame. Acquired data was normalized and relative fluorescence intensity is presented in relation with elapsed time. Black and blue line correspond to the arrows in panel A. (C,D) Fluorescence intensity imaging of an iCML cell group being stimulated with epinephrine (100 μM). Number coding corresponds to areas within individual cells at which data acquisition was performed (fluorescence intensity). Top graph: Acquired data of individual iCML cells was normalized and relative fluorescence intensity is presented in relation with elapsed time. Bottom graph: The mean value of acquired data from multiple iCML cells (n = 12) is presented as a black line and the standard deviation is presented as the gray lines.

