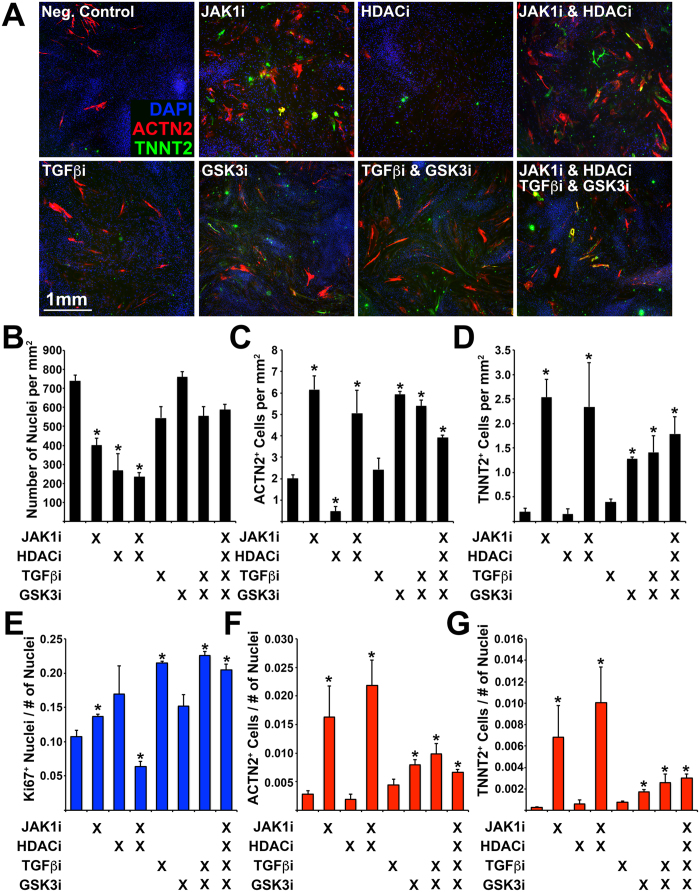
Figure 6. Determining the effect of small molecule inhibitors on transdifferentiation efficiency.
(A) Immunofluorescence of transdifferentiated cells (ACTN2/TNNT2) during exposure to small molecule inhibitors: Janus protein tyrosine kinase 1 (JAK1i), Sodium Butyrate (HDACi), SB431542 (TGFβi), CHIR99021 (GSK3i). (B) Number of nuclei, (C) Number of ACTN2+ cells, and (D) Number of TNNT2+ cells (per mm2). (E) Number of Ki67+ nuclei normalized to the total number of nuclei. (F) Number of ACTN2+ cells normalized to the total number of nuclei. (G) Number of TNNT2+ cells normalized to the total number of nuclei. Experiment performed in triplicate. 4 images were analyzed for each experiment. Error bar represents calculated standard deviation. Significant difference between two values was calculated using t-test (two-tailed distribution, two sample unequal variance).

