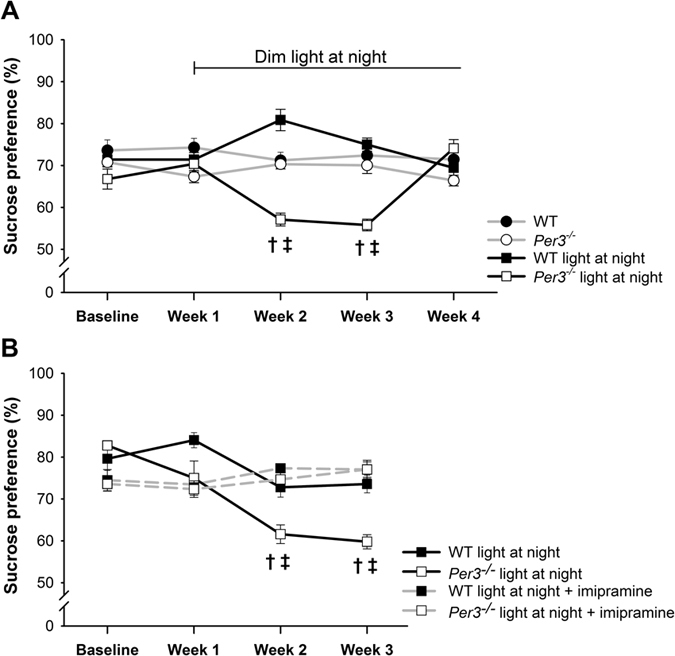
Figure 2.

Sucrose preference in WT and Per3−/− mice in (A) LD or dim light at night and (B) dim light at night, treated with tap water or imipramine in the drinking water. Values are presented as means and standard error of the mean. †p < 0.05 in comparison with the control group. ‡p < 0.05 in comparison with baseline. n = 6–8 males per group.
