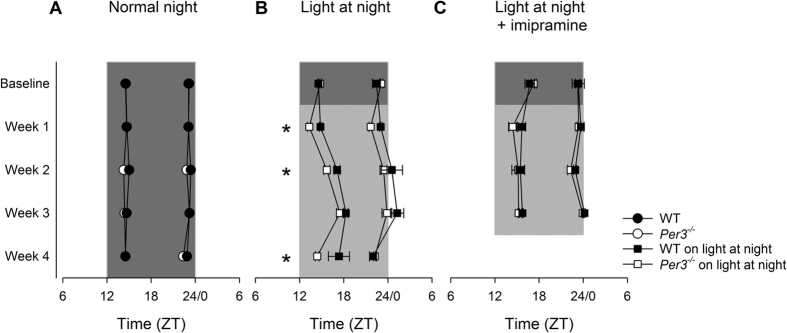
Figure 3. Phase of activity of the first and second peaks of activity.
(A) LD. (B) dLAN (C) dLAN and imipramine treatment. *p < 0.05 in comparison with WT. Circles represent mean and standard error of the mean of the first and second peaks of activity, areas indicate time between both peaks. Grey areas: dim light at night, dark grey areas: dark phase of the cycle. n = 6–8 males per group.

