
Figure 5.
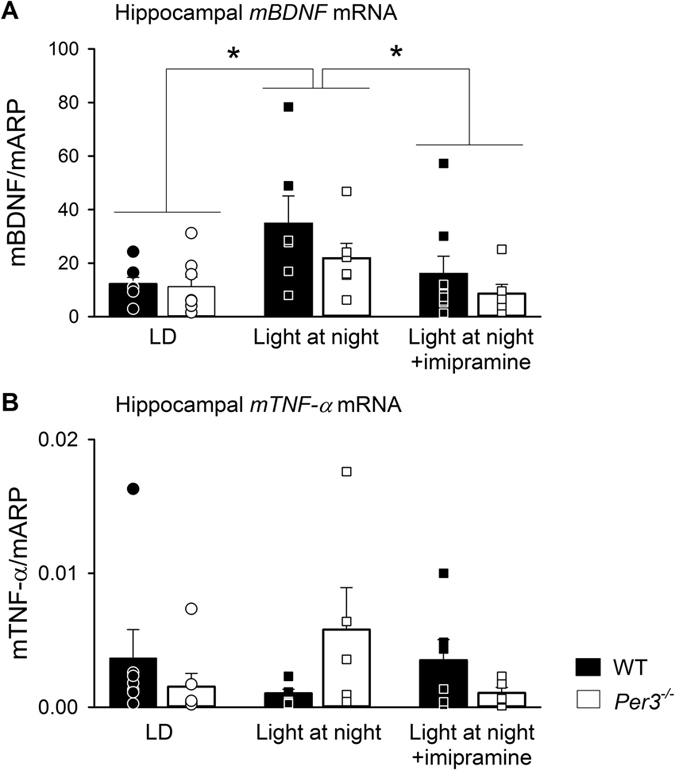
Expression of hippocampal Bdnf (A) and hippocampal Tnf-α (B). Data is shown as histograms of means and standard error of the mean, circles indicate individual values. Mice were killed at the end of week 4 for LD and week 3 for dLAN. n = 5-8 males per group. *p < 0.05.