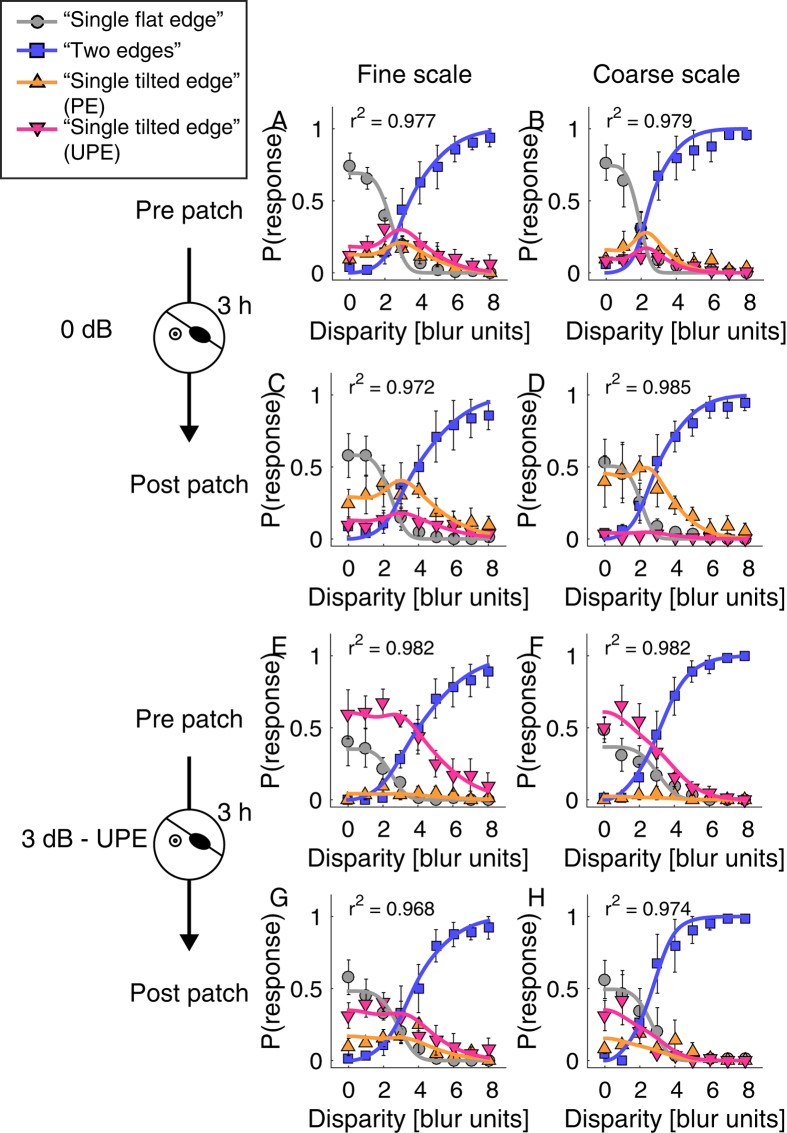
Figure 4. The effect of patching and contrast imbalance.
Y axis of each plot shows the probability of occurrence of each response as a function of interocular vertical disparity in units relative to the degree of scale. Top row (panels A,B) shows 0 dB contrast offset pre patching; second row (panels C,D) shows 0 dB contrast offset post 3 hours of patching. Panels E and F show 3 dB favoring the unpatched eye (UPE) pre patching and panels G and H show 3 dB favoring the unpatched eye (UPE) post patching. Error bars ± SE. The solid lines are model fits with r2 reported in each plot.

