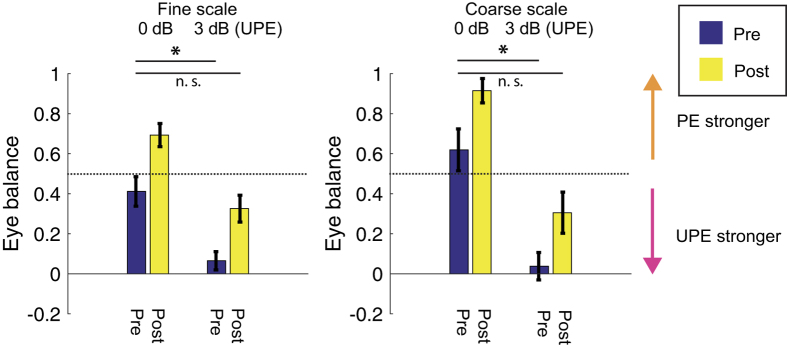
Figure 5. The effect of patching on the fitted Eye Balance Factor (EBF).
EBF ranges between 0 and 1; 1 ~full dominance of the patched eye, 0 ~full-dominance of the unpatched eye. Each pair of bars show the fitted value pre- (Purple) and post-patching (Yellow). The left pair in each panel shows the 0 dB contrast offset, right pair shows the 3 dB offset favoring the unpatched eye. The dotted line shows balanced input from the two eyes. Error bars depict the standard error of the parameter determined by the fitting routine. *p < 0.05 for a paired t-test.

