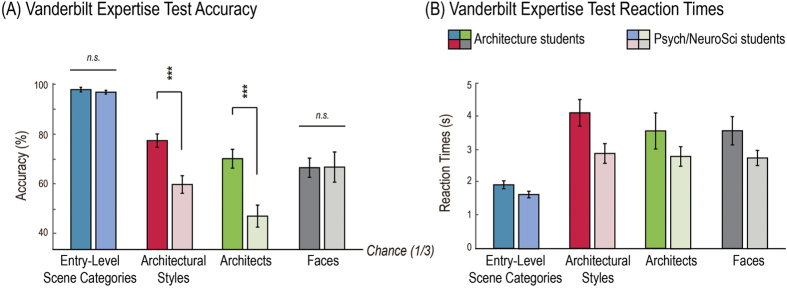
Figure 3.
Group-average accuracy rates (A) and reaction times (B) for the four categorization tasks. Dark-colored bars indicate behavioral performances of the eleven architecture students, and bright-colored bars indicate performances of the eleven psychology and neuroscience students. Different hues indicate the four visual categories: entry-level scene categories in blue, architectural styles in red, architects in green, and face identities in gray. Error bars show standard errors of mean. Accuracy of post-hoc comparisons is indicated above the bars. ***p < 0.001.

