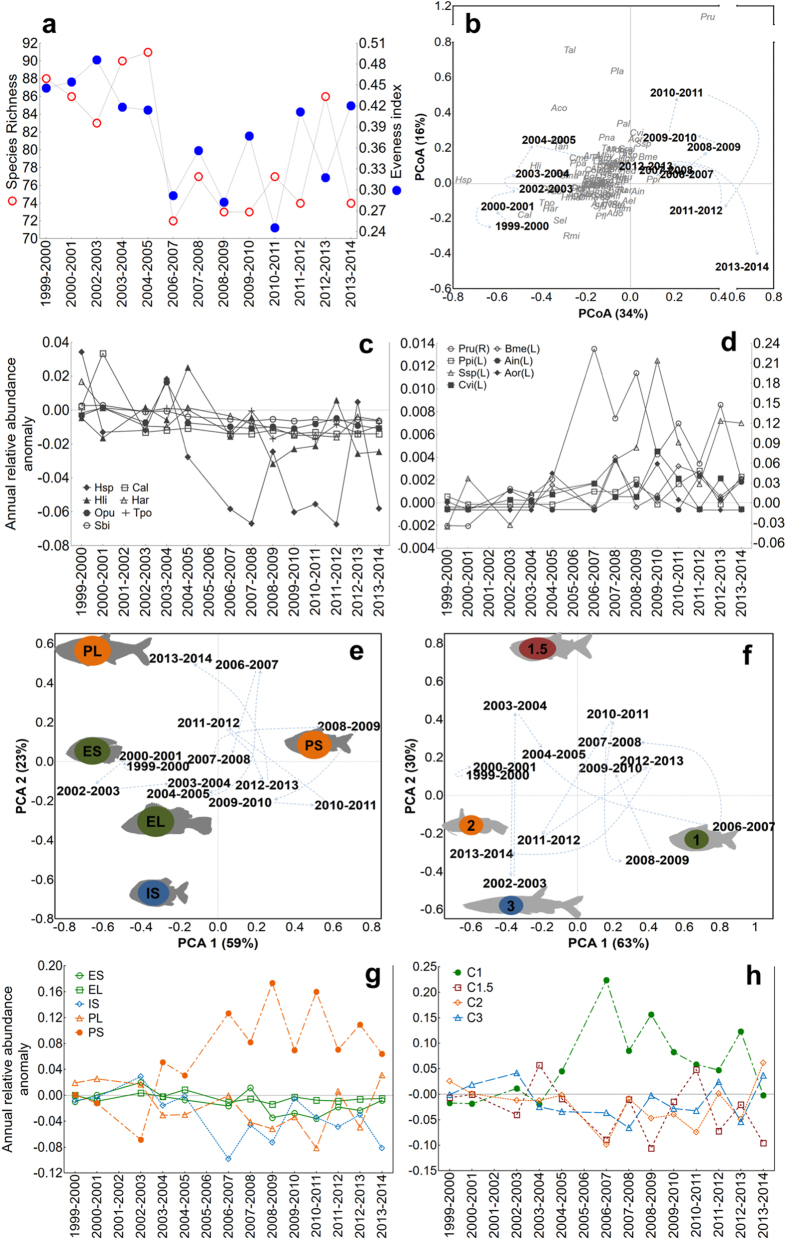
Figure 2. Temporal variation in species diversity and evenness, and ordination plots showing temporal variation in assemblage structure.
(a) Temporal variation in diversity (measured by species richness) and species evenness of the fish assemblage of Lago Catalão; (b) ordination plot revealing temporal variation in taxonomic structure, based on analysis of 97 species with abundance >0.01 individuals/m2 (CPUE); positive scores on PCoA1 are strongly associated with greater abundance of Psectrogaster rutiloides (Pru), Pinirampus pirinampu (Ppi) and Brycon melanopterus (Bme), and negative scores associated with greater abundance of most other species (species abbreviations appear in Dataset S2); (c) anomaly of the relative abundance for the seven species with lowest scores which decreased in abundance over time, and (d) for the seven species with highest scores which increased in abundance over time; values for species Pru are presented in the second y axis because its abundance is much greater than other species. (e) Ordination plot revealing temporal variation in life history structure: equilibrium-small (ES), equilibrium-large (EL), intermediate-small (IS), periodic-large (PL) and periodic-small (PS). (f) Ordination plot revealing temporal variation in trophic structure (C1- consumer level 1; C1.5- consumer level 1.5; C2- consumer level 2; C3- consumer level 3). Light blue dashed lines connect sequential years; vector scores were multiplied by a constant to improve plot visualization. (g) anomaly of the relative abundance for each life history group and (h) trophic level in the time series. Life history strategies based on data from specimens collected during surveys and review of published information and criteria in Winemiller (1989), and vertical trophic positions based on primary data and review of published dietary information. (c,d,g,h) Anomaly was calculated as the annual relative abundance minus the mean relative abundance before 2005, note that y axes of plots are scaled differently.

