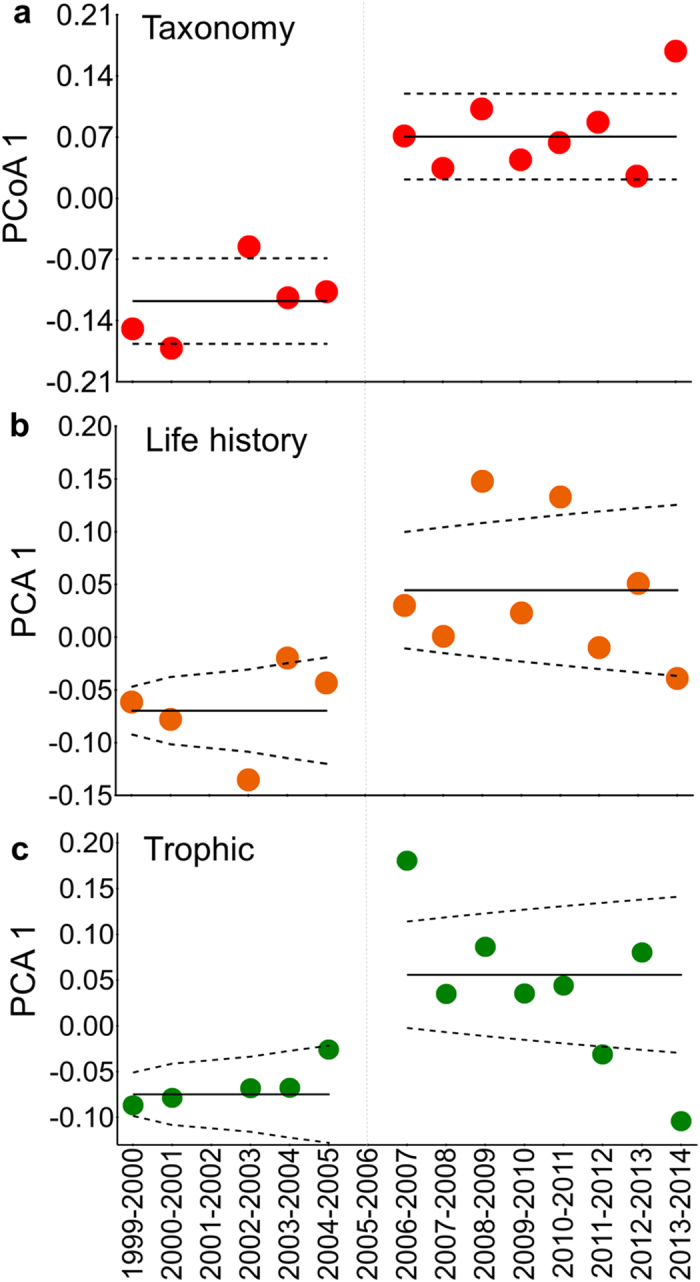
Figure 3. Temporal dynamics of assemblage structure as defined by scores on the first axis from PCA or PCoA ordinations.

Solid lines represent best-fit regression models describing time-series data (Table S2); dashed lines represent confidence intervals. Segmented step-mean regressions for each of three aspects of assemblage structure indicate major shifts following the 2005 drought followed by persistent structures under a new hydrologic regime (Fig. 1b).
