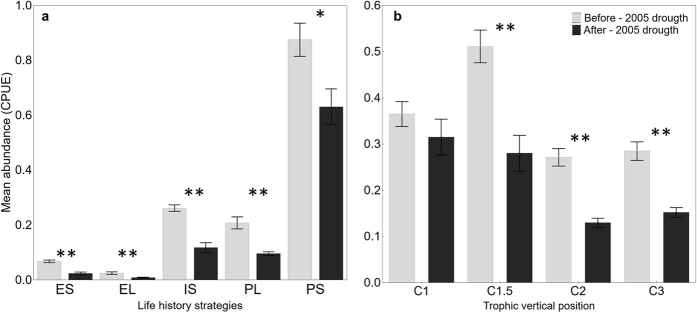
Figure 4.
Mean abundance of functional groups before and after the 2005 drought; mean and SE according to life history (a) and vertical trophic position (b). Note that y axes of plots are scaled differently; asterisks indicate significant differences in group abundance between the two periods (*P < 0.05; **P < 0.001). Trophic and life history strategy abbreviations are shown in Fig. 2.

