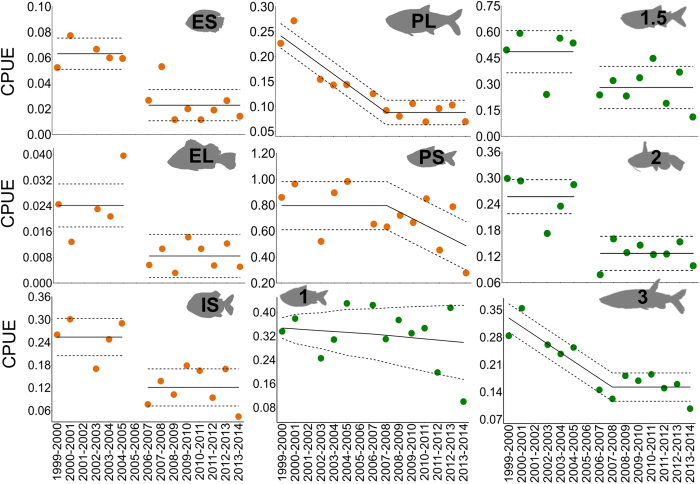
Figure 5. Temporal trends in abundance (CPUE) of functional groups identified by regression analysis.
Solid lines represent best-fit model predictions; dashed lines represent standard errors around mean estimates (Table S2). Abrupt shifts occurred after 2005 for ES, EL and IS life history strategies, and omnivores (consumer trophic level 1.5) and carnivores (consumer trophic level 2). Temporal changes were more gradual but with inflections during 2007–2008 for PL and PS life history strategies and piscivores (consumer trophic level 3). Abundance of herbivores and detritivores (consumer trophic level 1) revealed a trend of gradual decline but with poor model fit. Datasets S4–S5. Note that y axes of plots are scaled differently. Trophic and life history strategy abbreviations and symbols are shown in Fig. 2.

