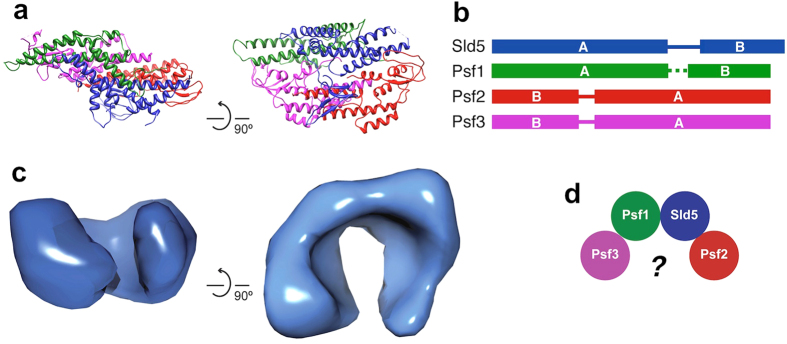
Figure 1. Structure and architecture of GINS complex.
(a) Ribbon representation of the crystallographic structure of human GINS12 (PDB ID: 2EHO) (b) Schematic diagram of the GINS subunits, highlighting the domain swap between the α-helical (A) and the β-rich (B) domains. (c) EM map of hGINS17 (EMD-1355) showing a C-shaped molecule. (d) To resolve the discrepancy between crystallographic and EM data a large rearrangement of the four GINS subunits has been proposed17.

