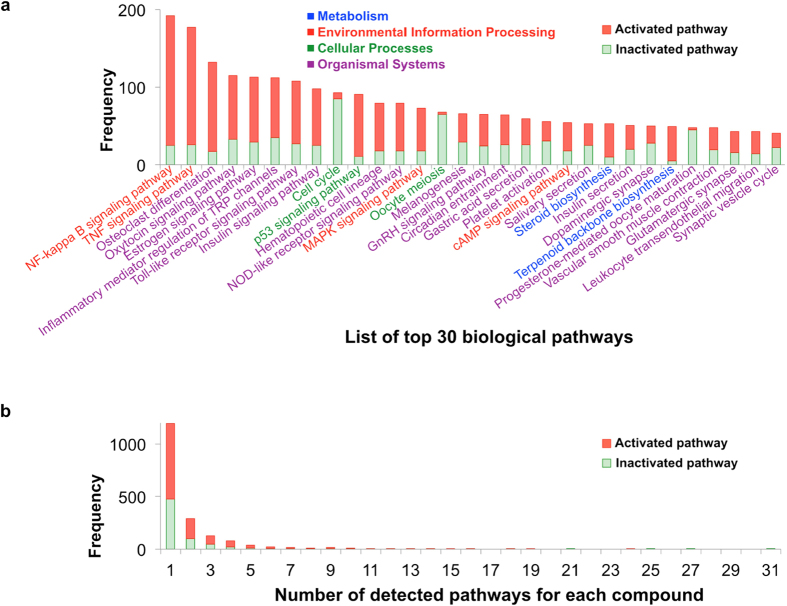
Figure 3. Distribution of the identified pathways.
(a) The histogram of detected pathways by the result of analyzing all compounds, where the horizontal axis indicates the list of biological pathways and the vertical axis indicates the frequency of detected pathways. (b) The histogram of the numbers of detected pathways for each compound, where the horizontal axis indicates the number of detected pathways for each compound and the vertical axis indicates the frequency of compounds. Red bars indicate the numbers of activated pathways, identified using upregulated genes, and green bars indicate the numbers of inactivated pathways, identified using downregulated genes. The pathways found in the KEGG categories Metabolism, Environmental Information Processing, Cellular Processes, and Organismal Systems are colored blue, red, green, and purple, respectively.

