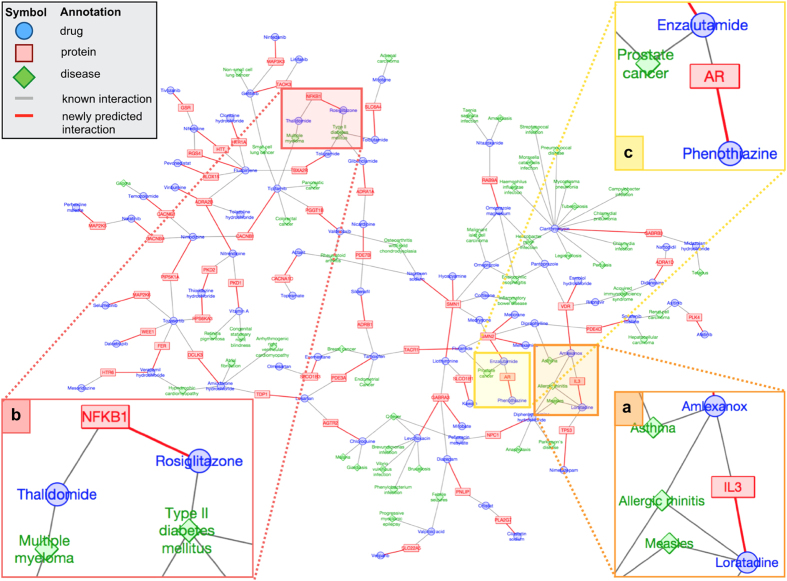
Figure 6. A small part of the drug–protein–disease network predicted using the LINCS-based method.
Three panels denoted to as (a–c) are examples of newly predicted target proteins of drugs (see Supplementary Fig. S9). Blue circles denote drugs, red rectangles denote target proteins, green diamonds indicate diseases, and gray edges and red lines denote known interactions and newly predicted interactions, respectively.

