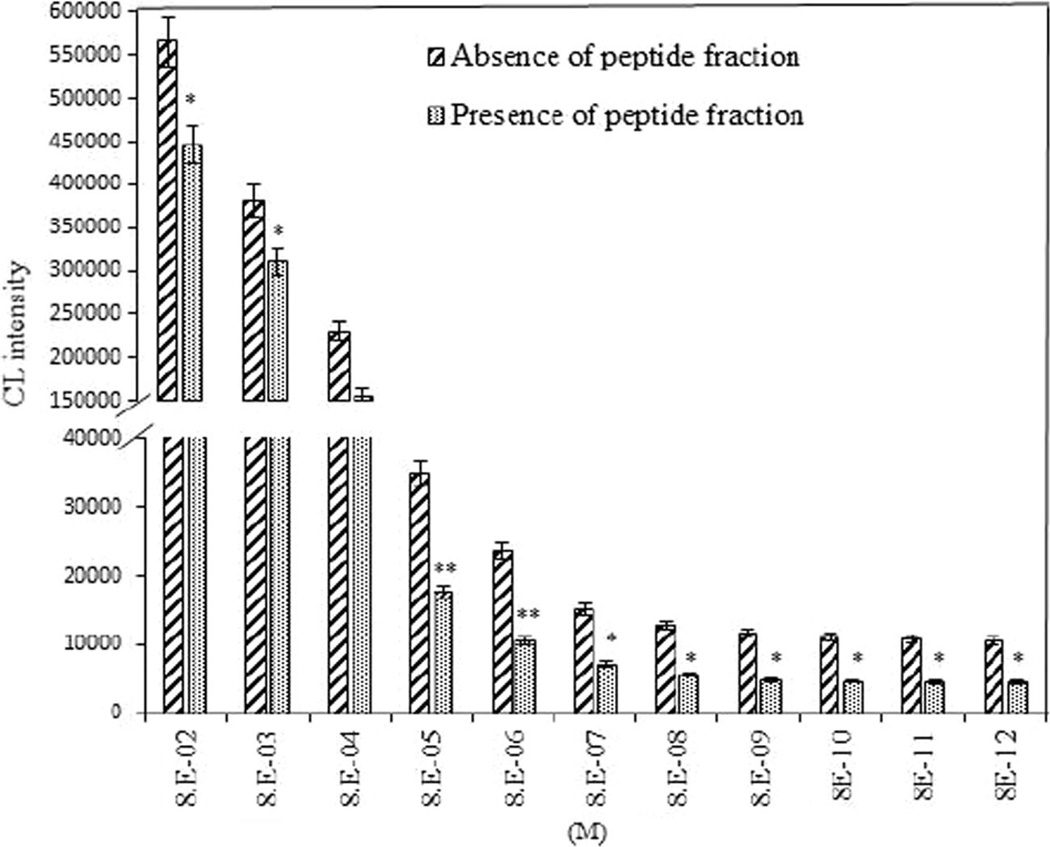
Fig. 4.
CL intensity of different hydrogen peroxide concentrations in the absence or presence of peptide fractions. The concentrations of luminol and peptide fraction were 100 µM and 750 µg/mL, respectively. Results represent the average of three independent measurements. A significant difference between two group (absence and presence of peptide) in each concentration of H2O2 was observed (*P < 0.05, and **P < 0.01 and)

