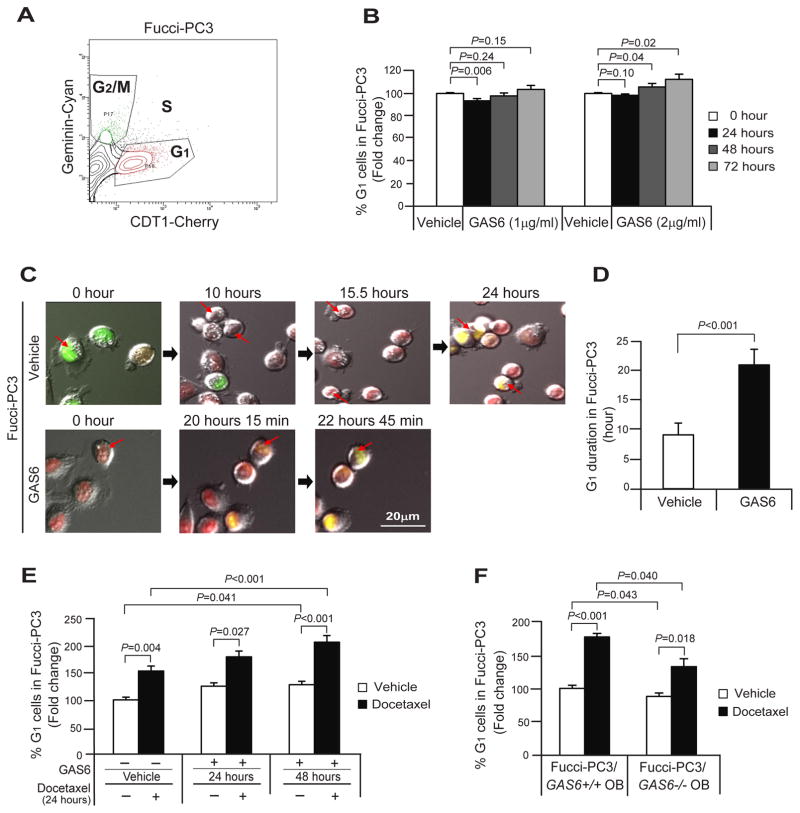
Fig. 2. GAS6 induces G1 cell cycle arrest in PCa cells during docetaxel chemotherapy.
(A) A flow profile of the cell cycle status; G1, S, and G2/M in Fucci-PC3 cells. (B) % G1 cells in Fucci-PC3 cells following treatment of GAS6 (0–2μg/ml) in standard culture conditions for 72 hours. (C) The living cell imaging of Fucci-PC3 (red arrows) following GAS6 (2μg/ml) treatment by video for 24 hours with 15 min interval by Deltavision Elite Microscope. Bar=20μm. (D) Quantification of G1 duration in the single cell from Fig. 2C (n=10/group). (E) % G1 cells in Fucci-PC3 cell culture following the treatment of docetaxel with the presence or absence of GAS6. (F) % G1 cells in cocultured Fucci-PC3 cells with GAS6 expressing wild-type osteoblasts (GAS6+/+ OB) or GAS6 deficient osteoblasts (GAS−/− OB) following the treatment of docetaxel. Data in Fig. 2B, D–F are representative of mean with s.d. (Student’s t-test).

